| Red | Green | Blue | |
| z | 17.64 | ||
| znorm | Inf | ||
| sky | -Inf | -Inf | -Inf |
| S/N | 29.6 | 49.9 | 59.1 |
| S/N(c) | 0.0 | 0.0 | 0.0 |
| SN(E/C) |

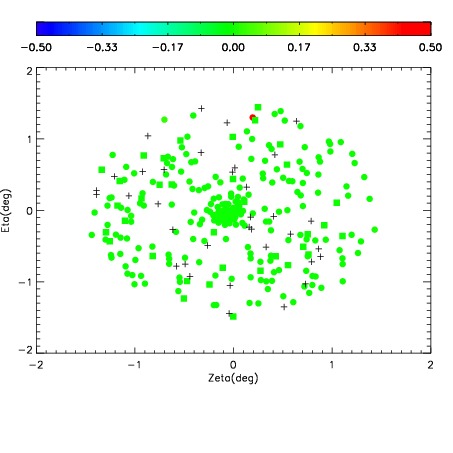

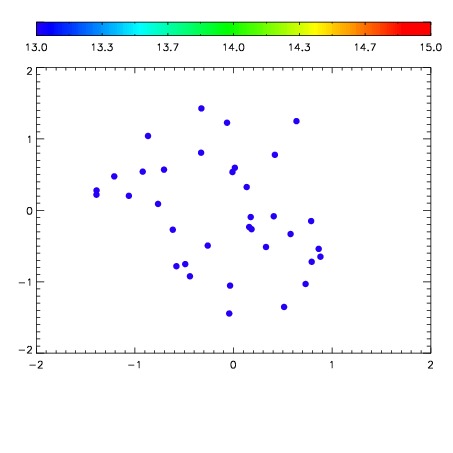

| Frame | Nreads | Zeropoints | Mag plots | Spatial mag deviation | Spatial sky 16325A emission deviations (filled: sky, open: star) | Spatial sky continuum emission | Spatial sky telluric CO2 absorption deviations (filled: H < 10) | |||||||||||||||||||||||
| 0 | 0 |
|
|
|
|
|
|
| IPAIR | NAME | SHIFT | NEWSHIFT | S/N | NAME | SHIFT | NEWSHIFT | S/N |
| 0 | 04650038 | 0.500286 | 0.00000 | 182.450 | 04650040 | 0.00436193 | 0.495924 | 181.833 |
| 1 | 04650037 | 0.496604 | 0.00368199 | 180.955 | 04650039 | 0.00497052 | 0.495315 | 180.795 |
| 2 | 04650042 | 0.499709 | 0.000576973 | 175.055 | 04650036 | 0.00000 | 0.500286 | 177.364 |
| 3 | 04650041 | 0.497840 | 0.00244600 | 174.421 | 04650043 | 0.00293545 | 0.497351 | 172.783 |