| Red | Green | Blue | |
| z | 17.64 | ||
| znorm | Inf | ||
| sky | -Inf | -Inf | -Inf |
| S/N | 23.8 | 41.8 | 48.0 |
| S/N(c) | 0.0 | 0.0 | 0.0 |
| SN(E/C) |
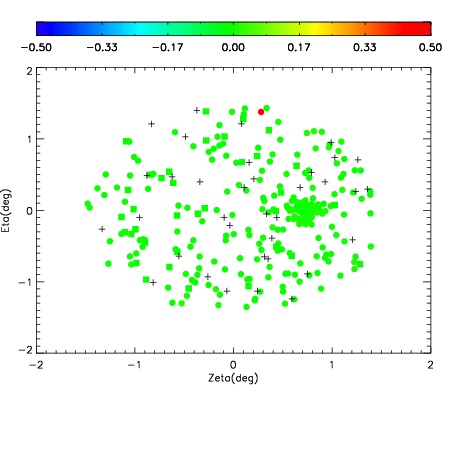
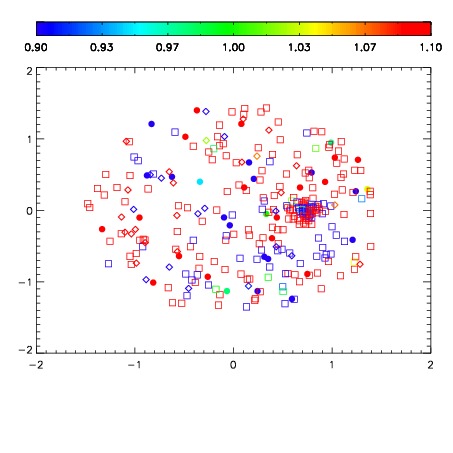
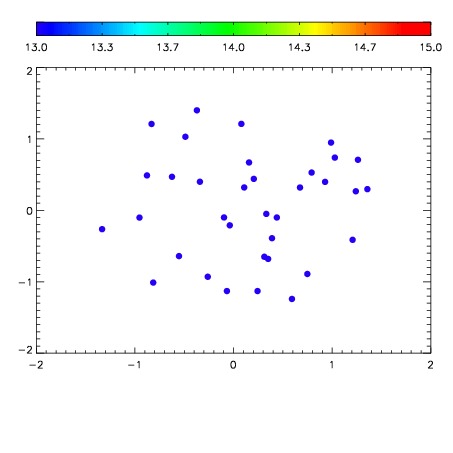

| Frame | Nreads | Zeropoints | Mag plots | Spatial mag deviation | Spatial sky 16325A emission deviations (filled: sky, open: star) | Spatial sky continuum emission | Spatial sky telluric CO2 absorption deviations (filled: H < 10) | |||||||||||||||||||||||
| 0 | 0 |
|
|
|
|
|
|
| IPAIR | NAME | SHIFT | NEWSHIFT | S/N | NAME | SHIFT | NEWSHIFT | S/N |
| 0 | 05150045 | 0.499872 | 0.00000 | 237.856 | 05150046 | 0.00166849 | 0.498204 | 235.531 |
| 1 | 05150044 | 0.497398 | 0.00247401 | 235.393 | 05150043 | -0.00145335 | 0.501325 | 230.786 |
| 2 | 05150041 | 0.496691 | 0.00318101 | 232.207 | 05150042 | 0.00189742 | 0.497975 | 230.027 |
| 3 | 05150040 | 0.495498 | 0.00437400 | 223.106 | 05150039 | 0.00000 | 0.499872 | 218.828 |