| Red | Green | Blue | |
| z | 17.64 | ||
| znorm | Inf | ||
| sky | -Inf | -Inf | -Inf |
| S/N | 26.9 | 46.5 | 57.7 |
| S/N(c) | 0.0 | 0.0 | 0.0 |
| SN(E/C) |
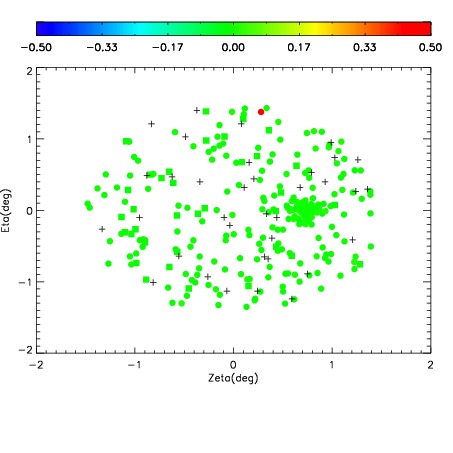
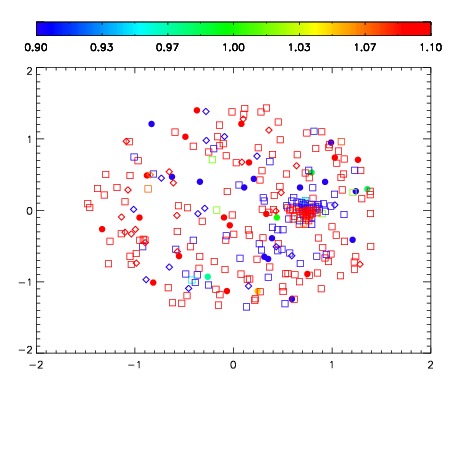
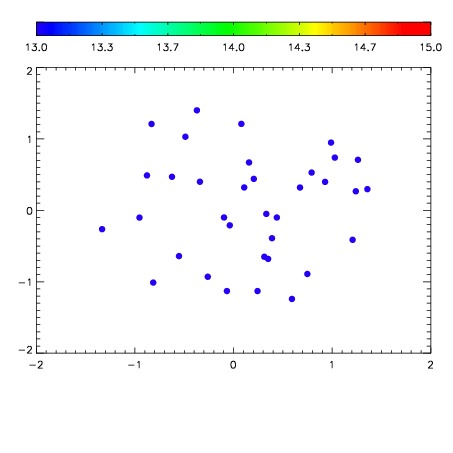

| Frame | Nreads | Zeropoints | Mag plots | Spatial mag deviation | Spatial sky 16325A emission deviations (filled: sky, open: star) | Spatial sky continuum emission | Spatial sky telluric CO2 absorption deviations (filled: H < 10) | |||||||||||||||||||||||
| 0 | 0 |
|
|
|
|
|
|
| IPAIR | NAME | SHIFT | NEWSHIFT | S/N | NAME | SHIFT | NEWSHIFT | S/N |
| 0 | 07850102 | 0.471893 | 0.00000 | 170.820 | 07850096 | 0.00192048 | 0.469973 | 172.492 |
| 1 | 07850101 | 0.471069 | 0.000824004 | 174.536 | 07850099 | 0.00418711 | 0.467706 | 174.677 |
| 2 | 07850097 | 0.467762 | 0.00413102 | 174.271 | 07850103 | 0.00559888 | 0.466294 | 173.872 |
| 3 | 07850098 | 0.468317 | 0.00357601 | 169.201 | 07850100 | 0.00356941 | 0.468324 | 170.111 |
| 4 | 07850094 | 0.469552 | 0.00234100 | 168.873 | 07850095 | 0.00392921 | 0.467964 | 168.053 |
| 5 | 07850093 | 0.469264 | 0.00262901 | 159.285 | 07850092 | 0.00000 | 0.471893 | 153.653 |