| Red | Green | Blue | |
| z | 17.64 | ||
| znorm | Inf | ||
| sky | -Inf | -NaN | -Inf |
| S/N | 26.0 | 41.8 | 48.9 |
| S/N(c) | 0.0 | 0.0 | 0.0 |
| SN(E/C) |
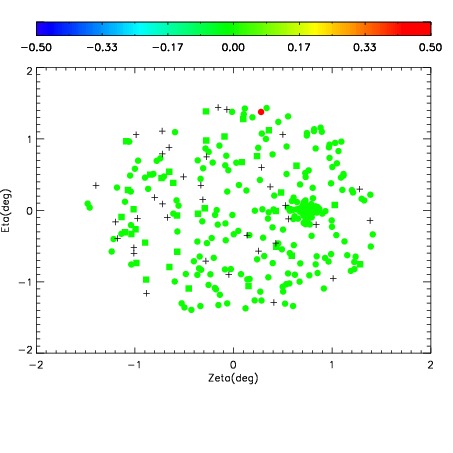
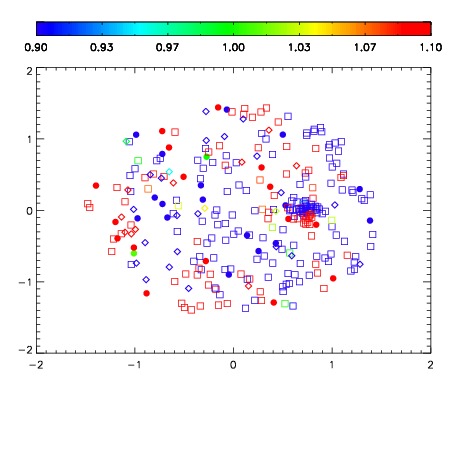
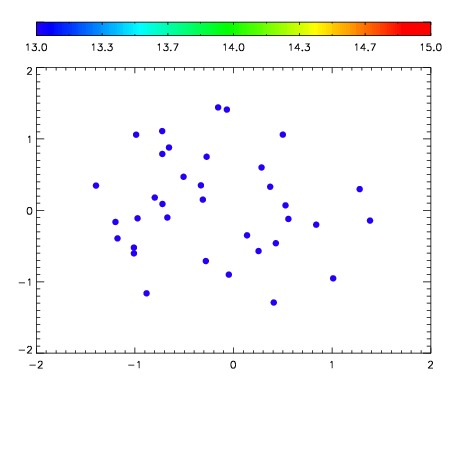

| Frame | Nreads | Zeropoints | Mag plots | Spatial mag deviation | Spatial sky 16325A emission deviations (filled: sky, open: star) | Spatial sky continuum emission | Spatial sky telluric CO2 absorption deviations (filled: H < 10) | |||||||||||||||||||||||
| 0 | 0 |
|
|
|
|
|
|
| IPAIR | NAME | SHIFT | NEWSHIFT | S/N | NAME | SHIFT | NEWSHIFT | S/N |
| 0 | 05190043 | 0.495814 | 0.00000 | 213.838 | 05190041 | 0.00243209 | 0.493382 | 215.603 |
| 1 | 05190039 | 0.491709 | 0.00410500 | 221.200 | 05190040 | 0.000415309 | 0.495399 | 221.040 |
| 2 | 05190038 | 0.492239 | 0.00357500 | 217.799 | 05190037 | 0.00000 | 0.495814 | 217.853 |
| 3 | 05190042 | 0.495776 | 3.79980e-05 | 212.221 | 05190044 | 0.000515651 | 0.495298 | 211.926 |