| Red | Green | Blue | |
| z | 17.64 | ||
| znorm | Inf | ||
| sky | -Inf | -Inf | -Inf |
| S/N | 21.6 | 36.3 | 40.3 |
| S/N(c) | 0.0 | 0.0 | 0.0 |
| SN(E/C) |
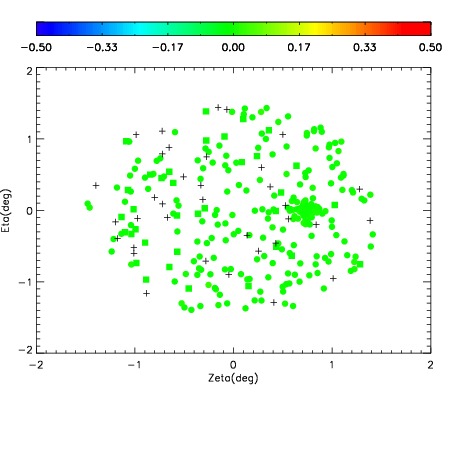
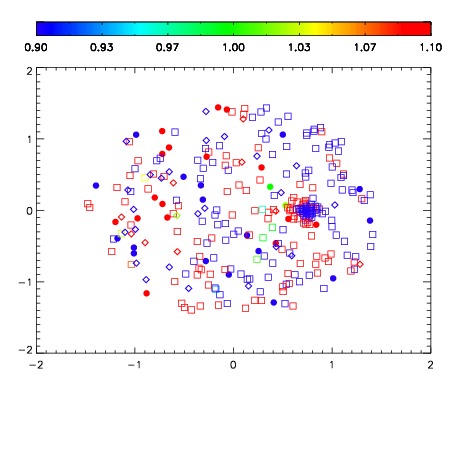
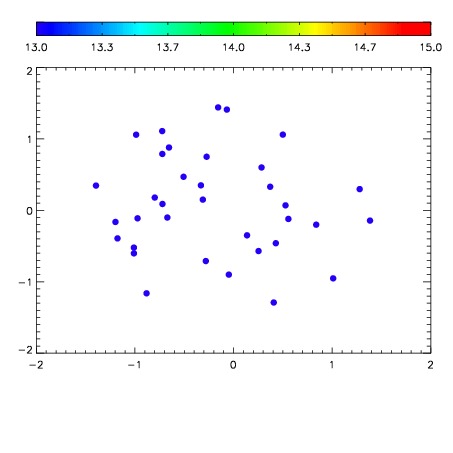

| Frame | Nreads | Zeropoints | Mag plots | Spatial mag deviation | Spatial sky 16325A emission deviations (filled: sky, open: star) | Spatial sky continuum emission | Spatial sky telluric CO2 absorption deviations (filled: H < 10) | |||||||||||||||||||||||
| 0 | 0 |
|
|
|
|
|
|
| IPAIR | NAME | SHIFT | NEWSHIFT | S/N | NAME | SHIFT | NEWSHIFT | S/N |
| 0 | 05490023 | 0.486915 | 0.00000 | 183.732 | 05490022 | 0.00000 | 0.486915 | 186.900 |
| 1 | 05490028 | 0.486658 | 0.000256985 | 181.562 | 05490025 | 0.00134164 | 0.485573 | 175.121 |
| 2 | 05490024 | 0.486888 | 2.70009e-05 | 177.755 | 05490026 | 0.00118881 | 0.485726 | 172.626 |
| 3 | 05490027 | 0.485891 | 0.00102398 | 172.217 | 05490029 | 0.00202522 | 0.484890 | 162.382 |