| Red | Green | Blue | |
| z | 17.64 | ||
| znorm | Inf | ||
| sky | -Inf | -Inf | -Inf |
| S/N | 16.7 | 33.4 | 37.9 |
| S/N(c) | 0.0 | 0.0 | 0.0 |
| SN(E/C) |
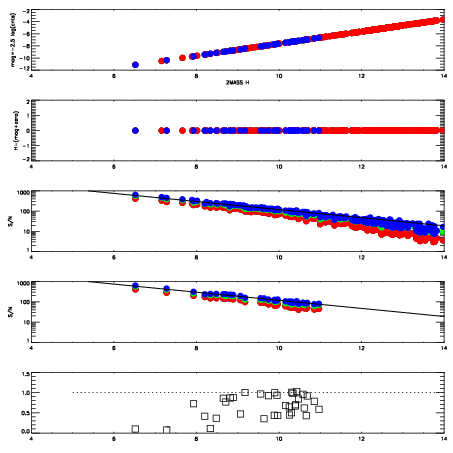
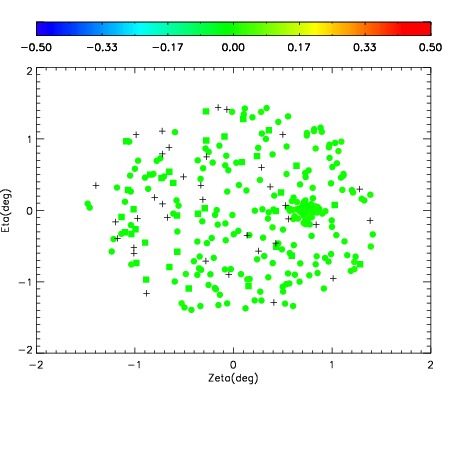
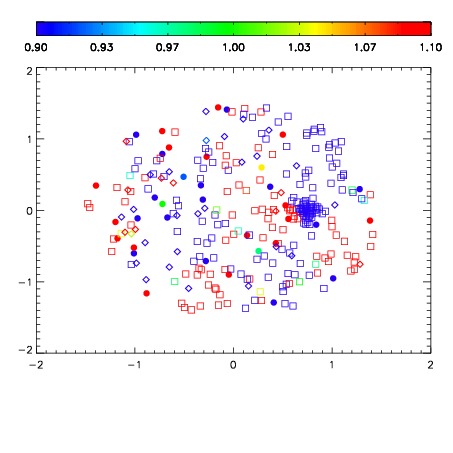
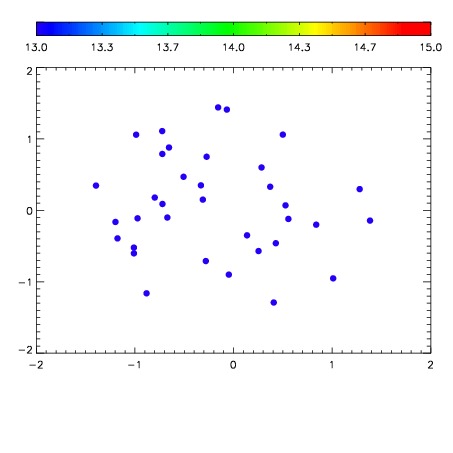

| Frame | Nreads | Zeropoints | Mag plots | Spatial mag deviation | Spatial sky 16325A emission deviations (filled: sky, open: star) | Spatial sky continuum emission | Spatial sky telluric CO2 absorption deviations (filled: H < 10) | |||||||||||||||||||||||
| 0 | 0 |
|
|
|
|
|
|
| IPAIR | NAME | SHIFT | NEWSHIFT | S/N | NAME | SHIFT | NEWSHIFT | S/N |
| 0 | 07900072 | 0.471576 | 0.00000 | 171.701 | 07900073 | -0.000217290 | 0.471793 | 169.181 |
| 1 | 07900075 | 0.470079 | 0.00149700 | 179.887 | 07900070 | 0.00000 | 0.471576 | 181.489 |
| 2 | 07900071 | 0.470659 | 0.000917017 | 175.387 | 07900074 | -0.000663515 | 0.472240 | 171.314 |
| 3 | 07900076 | 0.469539 | 0.00203702 | 165.770 | 07900077 | -0.000540254 | 0.472116 | 162.510 |