| Red | Green | Blue | |
| z | 17.64 | ||
| znorm | Inf | ||
| sky | -NaN | -Inf | -Inf |
| S/N | 11.8 | 21.3 | 27.0 |
| S/N(c) | 0.0 | 0.0 | 0.0 |
| SN(E/C) |
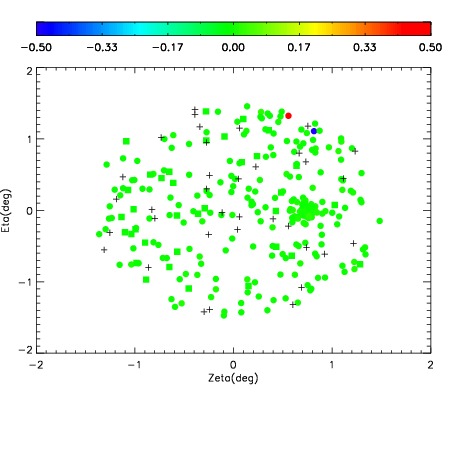
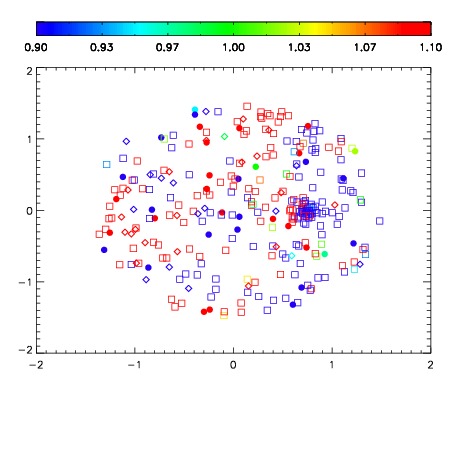
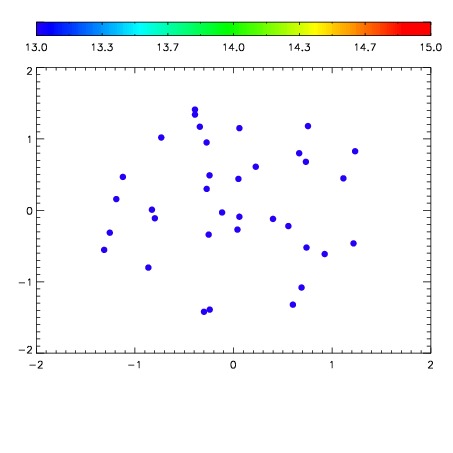

| Frame | Nreads | Zeropoints | Mag plots | Spatial mag deviation | Spatial sky 16325A emission deviations (filled: sky, open: star) | Spatial sky continuum emission | Spatial sky telluric CO2 absorption deviations (filled: H < 10) | |||||||||||||||||||||||
| 0 | 0 |
|
|
|
|
|
|
| IPAIR | NAME | SHIFT | NEWSHIFT | S/N | NAME | SHIFT | NEWSHIFT | S/N |
| 0 | 05210039 | 0.502737 | 0.00000 | 108.644 | 05210044 | 0.00185448 | 0.500883 | 101.797 |
| 1 | 05210038 | 0.502441 | 0.000295997 | 118.041 | 05210037 | 0.00000 | 0.502737 | 114.737 |
| 2 | 05210043 | 0.497545 | 0.00519198 | 109.105 | 05210040 | 7.38503e-05 | 0.502663 | 108.406 |
| 3 | 05210042 | 0.496540 | 0.00619698 | 99.3003 | 05210041 | -0.00127614 | 0.504013 | 98.0400 |