| Red | Green | Blue | |
| z | 17.64 | ||
| znorm | Inf | ||
| sky | -Inf | -Inf | -Inf |
| S/N | 27.1 | 46.8 | 53.0 |
| S/N(c) | 0.0 | 0.0 | 0.0 |
| SN(E/C) |
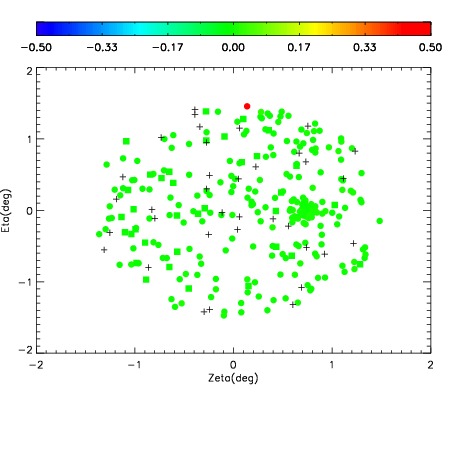
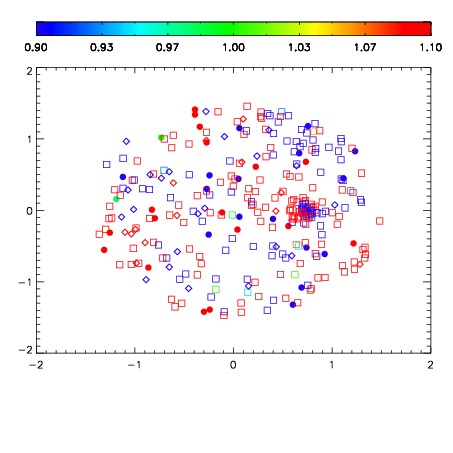
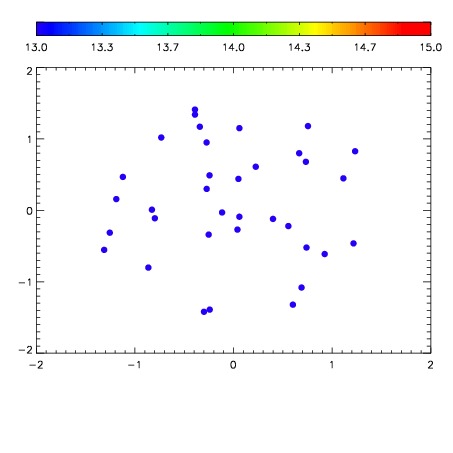

| Frame | Nreads | Zeropoints | Mag plots | Spatial mag deviation | Spatial sky 16325A emission deviations (filled: sky, open: star) | Spatial sky continuum emission | Spatial sky telluric CO2 absorption deviations (filled: H < 10) | |||||||||||||||||||||||
| 0 | 0 |
|
|
|
|
|
|
| IPAIR | NAME | SHIFT | NEWSHIFT | S/N | NAME | SHIFT | NEWSHIFT | S/N |
| 0 | 08770038 | 0.480731 | 0.00000 | 190.634 | 08770032 | 0.00000 | 0.480731 | 190.869 |
| 1 | 08770037 | 0.479541 | 0.00119001 | 197.001 | 08770039 | 0.00411895 | 0.476612 | 193.316 |
| 2 | 08770034 | 0.478155 | 0.00257602 | 195.371 | 08770035 | 0.00198124 | 0.478750 | 192.848 |
| 3 | 08770033 | 0.477169 | 0.00356200 | 195.029 | 08770036 | 0.00166234 | 0.479069 | 191.832 |