| Red | Green | Blue | |
| z | 17.64 | ||
| znorm | Inf | ||
| sky | -Inf | -Inf | -Inf |
| S/N | 29.5 | 46.5 | 58.1 |
| S/N(c) | 0.0 | 0.0 | 0.0 |
| SN(E/C) |
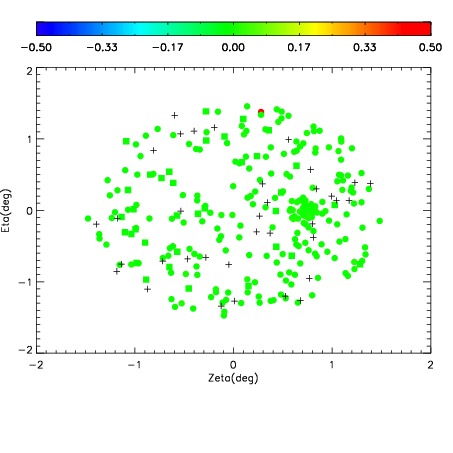
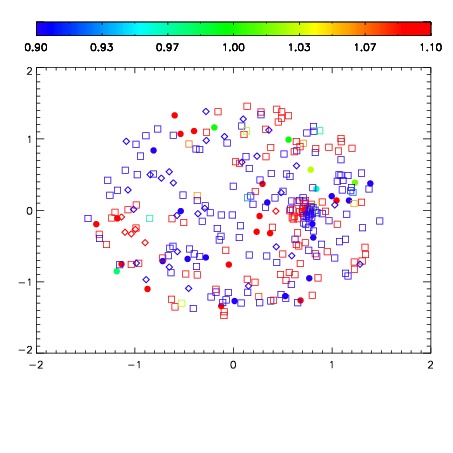
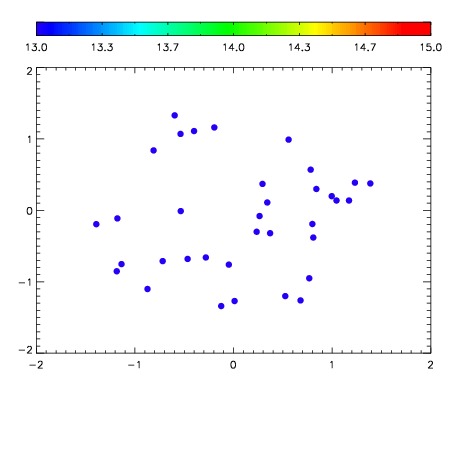

| Frame | Nreads | Zeropoints | Mag plots | Spatial mag deviation | Spatial sky 16325A emission deviations (filled: sky, open: star) | Spatial sky continuum emission | Spatial sky telluric CO2 absorption deviations (filled: H < 10) | |||||||||||||||||||||||
| 0 | 0 |
|
|
|
|
|
|
| IPAIR | NAME | SHIFT | NEWSHIFT | S/N | NAME | SHIFT | NEWSHIFT | S/N |
| 0 | 05240047 | 0.501676 | 0.00000 | 188.238 | 05240048 | 0.00548773 | 0.496188 | 186.603 |
| 1 | 05240043 | 0.497838 | 0.00383803 | 193.881 | 05240045 | 0.00149394 | 0.500182 | 193.898 |
| 2 | 05240046 | 0.498655 | 0.00302103 | 193.604 | 05240044 | 0.00376790 | 0.497908 | 191.941 |
| 3 | 05240042 | 0.498134 | 0.00354204 | 190.897 | 05240041 | 0.00000 | 0.501676 | 189.191 |