| Red | Green | Blue | |
| z | 17.64 | ||
| znorm | Inf | ||
| sky | -Inf | -Inf | -Inf |
| S/N | 27.5 | 49.2 | 52.8 |
| S/N(c) | 0.0 | 0.0 | 0.0 |
| SN(E/C) |
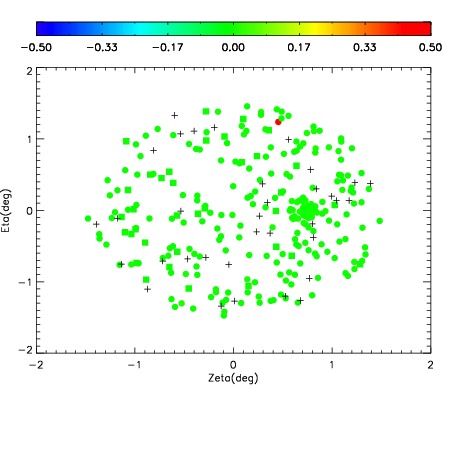
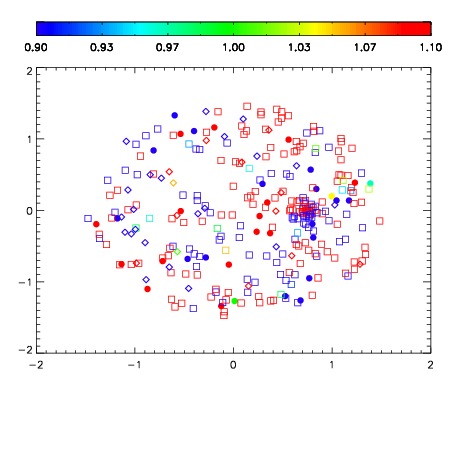
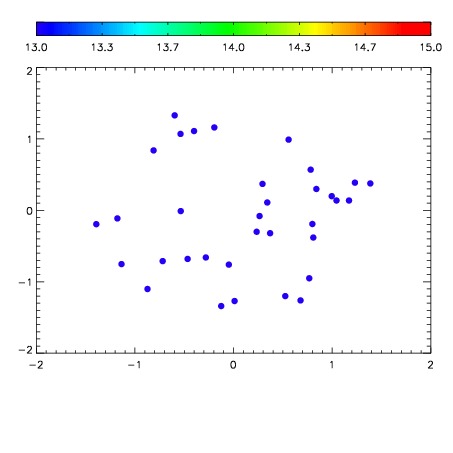

| Frame | Nreads | Zeropoints | Mag plots | Spatial mag deviation | Spatial sky 16325A emission deviations (filled: sky, open: star) | Spatial sky continuum emission | Spatial sky telluric CO2 absorption deviations (filled: H < 10) | |||||||||||||||||||||||
| 0 | 0 |
|
|
|
|
|
|
| IPAIR | NAME | SHIFT | NEWSHIFT | S/N | NAME | SHIFT | NEWSHIFT | S/N |
| 0 | 05440032 | 0.483690 | 0.00000 | 141.766 | 05440033 | -0.00201805 | 0.485708 | 137.908 |
| 1 | 05440031 | 0.483442 | 0.000247985 | 150.832 | 05440029 | -0.00115079 | 0.484841 | 151.671 |
| 2 | 05440027 | 0.481582 | 0.00210801 | 150.653 | 05440030 | -0.000690735 | 0.484381 | 147.660 |
| 3 | 05440028 | 0.481466 | 0.00222400 | 147.133 | 05440026 | 0.00000 | 0.483690 | 143.540 |