| Red | Green | Blue | |
| z | 17.64 | ||
| znorm | Inf | ||
| sky | -Inf | -Inf | -Inf |
| S/N | 25.7 | 45.8 | 51.5 |
| S/N(c) | 0.0 | 0.0 | 0.0 |
| SN(E/C) |
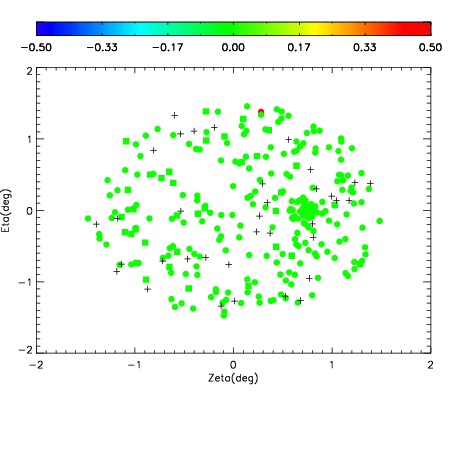
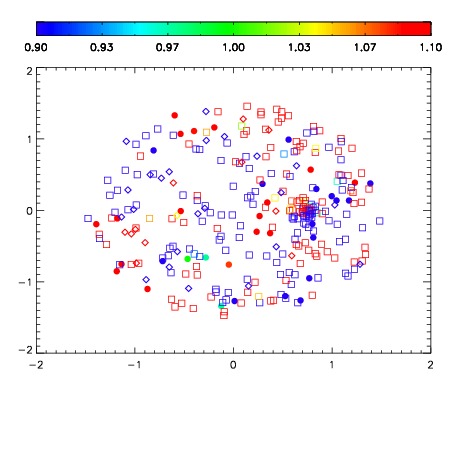
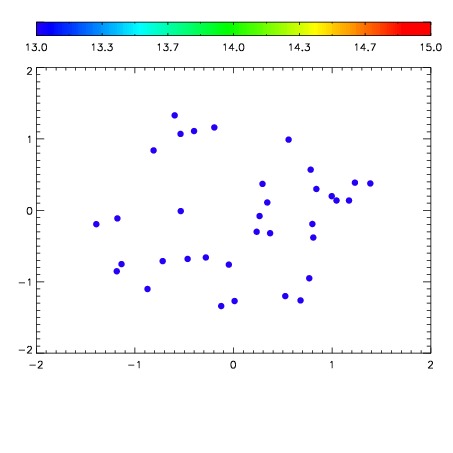

| Frame | Nreads | Zeropoints | Mag plots | Spatial mag deviation | Spatial sky 16325A emission deviations (filled: sky, open: star) | Spatial sky continuum emission | Spatial sky telluric CO2 absorption deviations (filled: H < 10) | |||||||||||||||||||||||
| 0 | 0 |
|
|
|
|
|
|
| IPAIR | NAME | SHIFT | NEWSHIFT | S/N | NAME | SHIFT | NEWSHIFT | S/N |
| 0 | 08400061 | 0.510489 | 0.00000 | 139.814 | 08400062 | 0.00276878 | 0.507720 | 146.200 |
| 1 | 08400065 | 0.509925 | 0.000563979 | 154.628 | 08400066 | 0.00242331 | 0.508066 | 158.668 |
| 2 | 08400064 | 0.509185 | 0.00130397 | 152.162 | 08400063 | 0.00163802 | 0.508851 | 146.469 |
| 3 | 08400060 | 0.510385 | 0.000104010 | 133.258 | 08400059 | 0.00000 | 0.510489 | 126.816 |