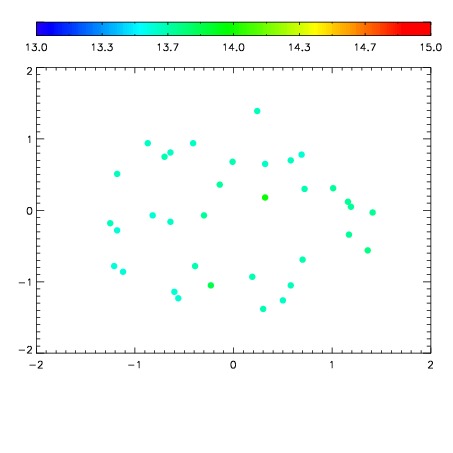
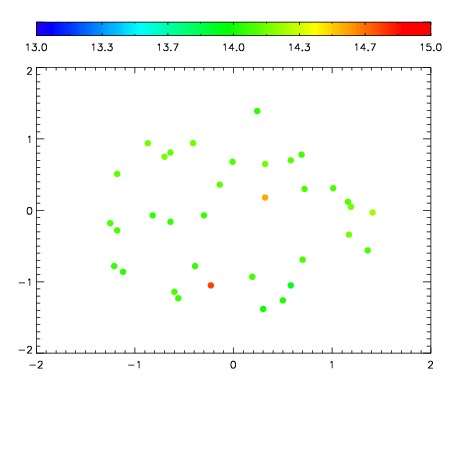
| Frame | Nreads | Zeropoints | Mag plots
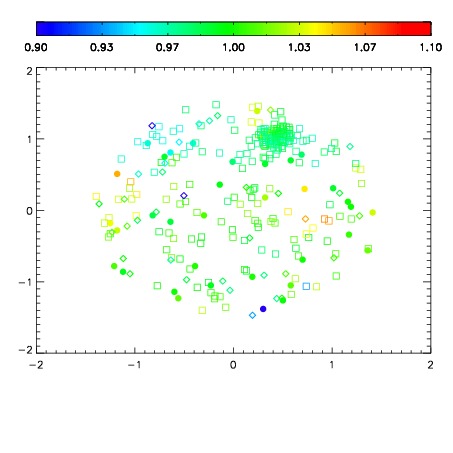
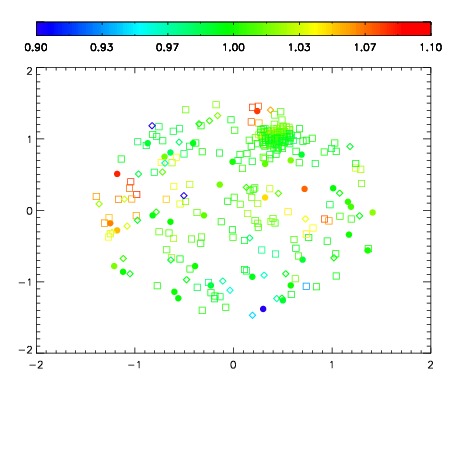
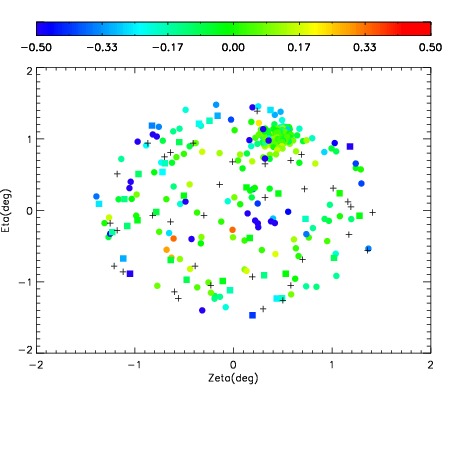
| Spatial mag deviation
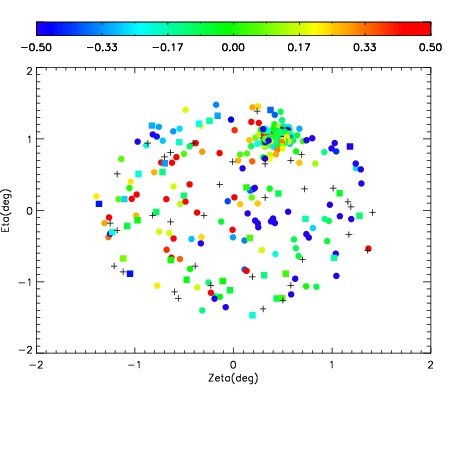
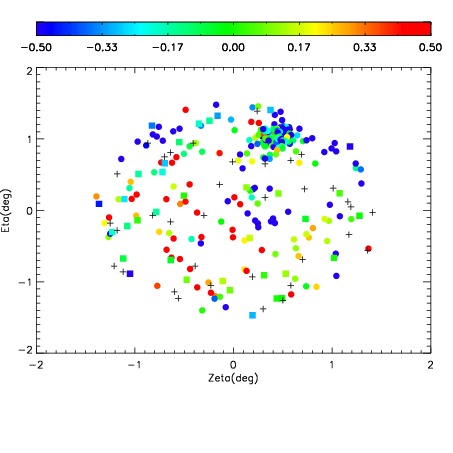
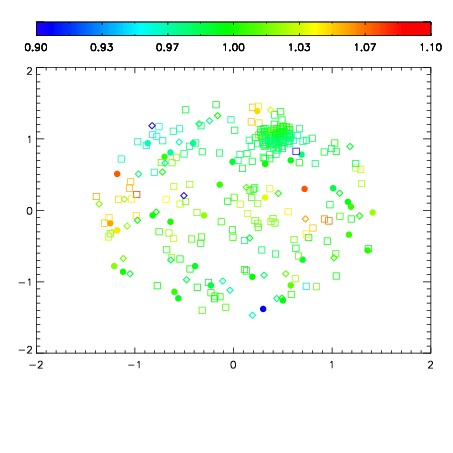
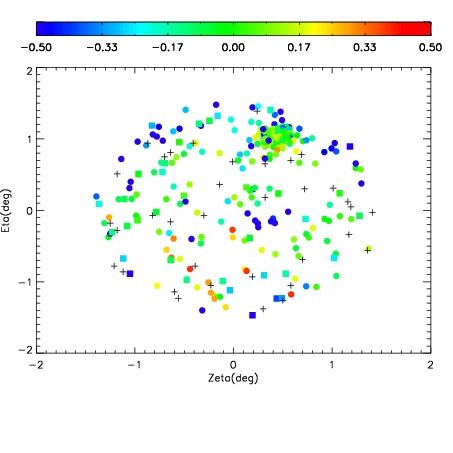
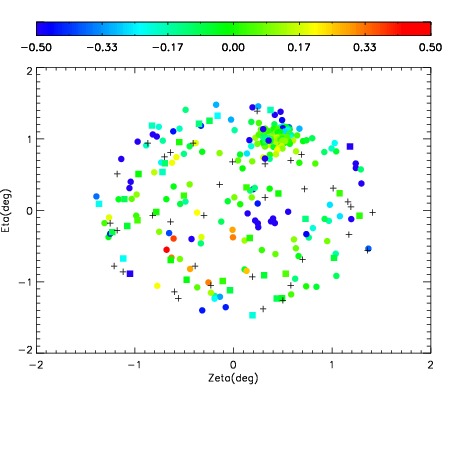
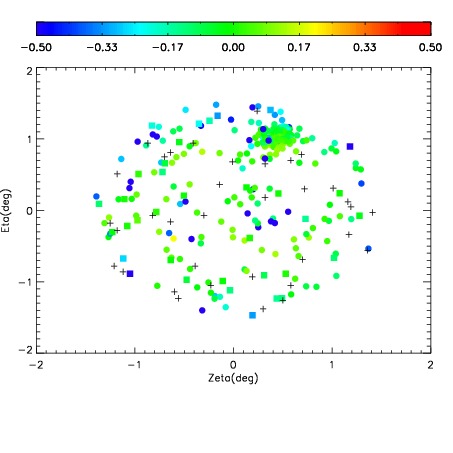
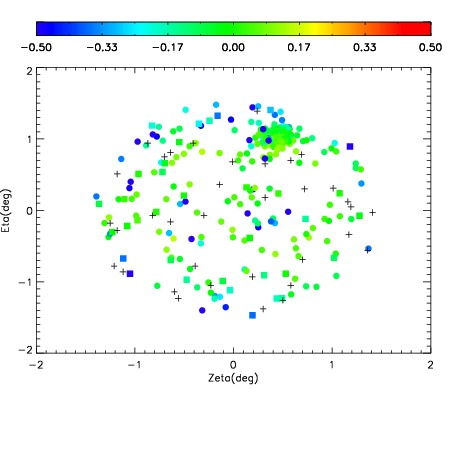
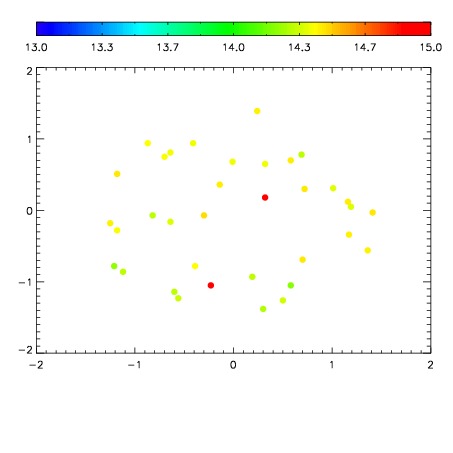
| Spatial sky 16325A emission deviations (filled: sky, open: star)
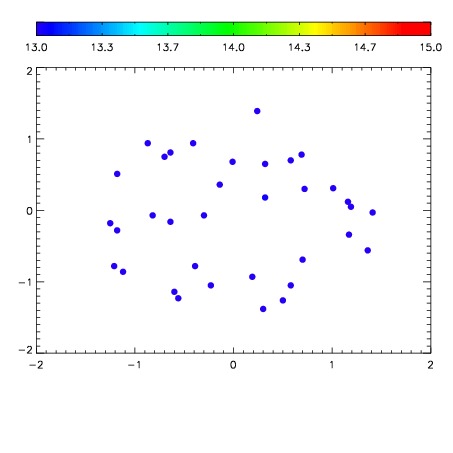
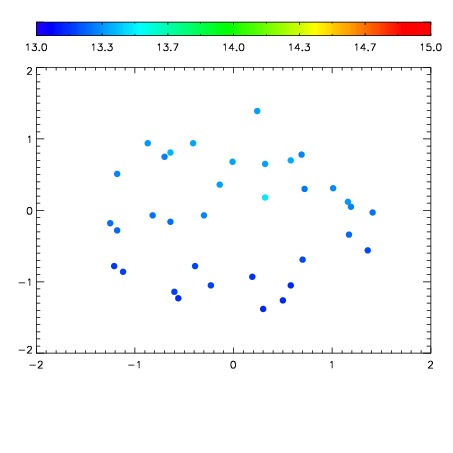
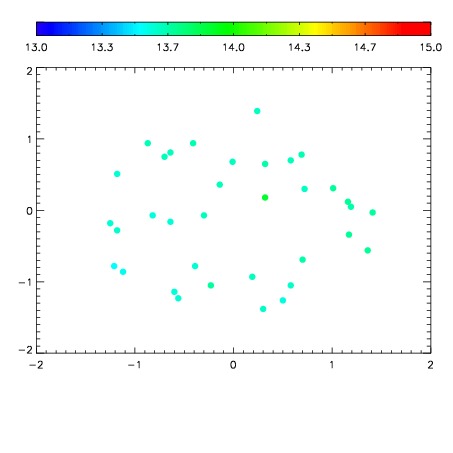
| Spatial sky continuum emission
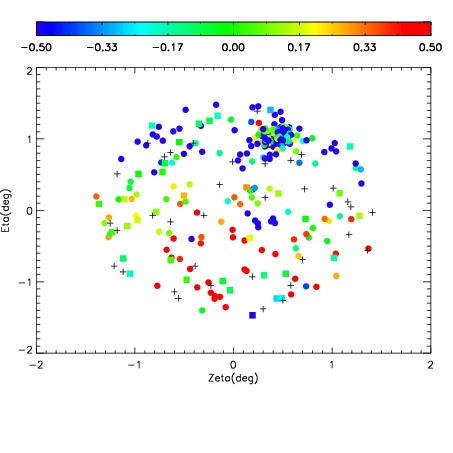
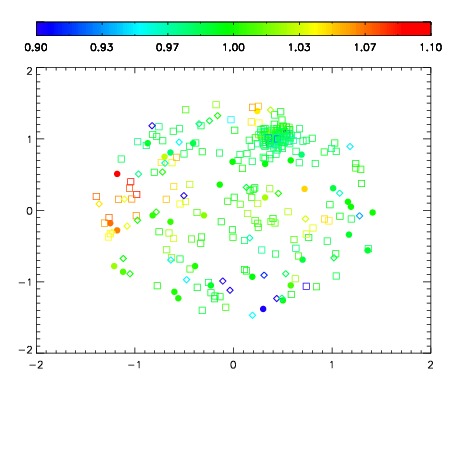
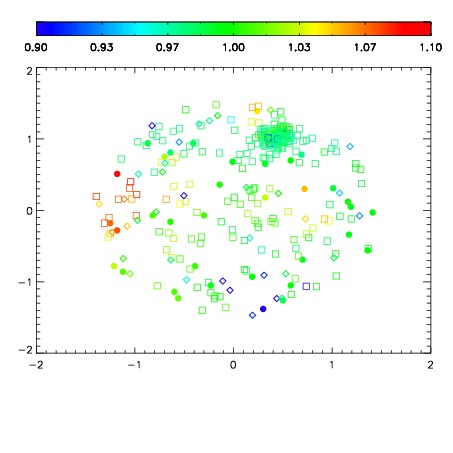
| Spatial sky telluric CO2 absorption deviations (filled: H < 10)
|
| 4040095
| 47
| | Red | Green | Blue
| | z | | 16.34
| | znorm | | 12.16
| | sky | 13.0 | 12.9 | 12.8
| | S/N | 1.6 | 3.2 | 1.7
| | S/N(c) | 1.1 | 2.6 | 2.9
| | SN(E/C) 0.88
|
| 
| 
| 
| 
| 
|
| 4040096
| 47
| | Red | Green | Blue
| | z | | 16.03
| | znorm | | 11.85
| | sky | 13.0 | 12.9 | 12.8
| | S/N | 1.1 | 2.3 | 1.0
| | S/N(c) | 1.1 | 2.2 | 2.3
| | SN(E/C) 0.91
|
| 
| 
| 
| 
| 
|
| 4040097
| 47
| | Red | Green | Blue
| | z | | 17.32
| | znorm | | 13.14
| | sky | 13.5 | 13.4 | 13.3
| | S/N | 4.0 | 7.9 | 6.6
| | S/N(c) | 3.2 | 6.8 | 7.0
| | SN(E/C) 0.66
|
| 
| 
| 
| 
| 
|
| 4040098
| 47
| | Red | Green | Blue
| | z | | 16.31
| | znorm | | 12.13
| | sky | 13.4 | 13.3 | 13.2
| | S/N | 1.4 | 3.3 | 1.3
| | S/N(c) | 1.7 | 3.8 | 4.2
| | SN(E/C) 0.83
|
| 
| 
| 
| 
| 
|
| 4040099
| 47
| | Red | Green | Blue
| | z | | 17.04
| | znorm | | 12.86
| | sky | 13.5 | 13.4 | 13.3
| | S/N | 3.4 | 7.3 | 5.7
| | S/N(c) | 3.4 | 7.1 | 7.5
| | SN(E/C) 0.76
|
| 
| 
| 
| 
| 
|
| 4040100
| 47
| | Red | Green | Blue
| | z | | 16.44
| | znorm | | 12.26
| | sky | 13.2 | 13.1 | 13.1
| | S/N | 1.6 | 3.8 | 2.2
| | S/N(c) | 1.6 | 3.6 | 3.7
| | SN(E/C) 0.87
|
| 
| 
| 
| 
| 
|
| 4040101
| 47
| | Red | Green | Blue
| | z | | 17.15
| | znorm | | 12.97
| | sky | 13.7 | 13.6 | 13.6
| | S/N | 3.7 | 7.9 | 6.8
| | S/N(c) | 3.3 | 7.1 | 7.3
| | SN(E/C) 0.73
|
| 
| 
| 
| 
| 
|
| 4040102
| 47
| | Red | Green | Blue
| | z | | 16.83
| | znorm | | 12.65
| | sky | 13.4 | 13.3 | 13.2
| | S/N | 2.9 | 5.6 | 4.8
| | S/N(c) | 2.5 | 5.1 | 5.4
| | SN(E/C) 0.79
|
| 
| 
| 
| 
| 
|
| 4040103
| 47
| | Red | Green | Blue
| | z | | 17.12
| | znorm | | 12.94
| | sky | 13.4 | 13.3 | 13.3
| | S/N | 3.4 | 7.3 | 6.2
| | S/N(c) | 3.2 | 6.8 | 7.2
| | SN(E/C) 0.79
|
| 
| 
| 
| 
| 
|
| 4040104
| 47
| | Red | Green | Blue
| | z | | 17.79
| | znorm | | 13.61
| | sky | 13.8 | 13.6 | 13.6
| | S/N | 6.4 | 12.3 | 11.8
| | S/N(c) | 5.5 | 11.0 | 11.5
| | SN(E/C) 0.57
|
| 
| 
| 
| 
| 
|
| 4040105
| 47
| | Red | Green | Blue
| | z | | 18.44
| | znorm | | 14.26
| | sky | 14.1 | 14.1 | 13.9
| | S/N | 10.7 | 19.4 | 19.7
| | S/N(c) | 9.2 | 18.1 | 19.2
| | SN(E/C) 0.47
|
| 
| 
| 
| 
| 
|
| 4040106
| 47
| | Red | Green | Blue
| | z | | 18.75
| | znorm | | 14.57
| | sky | 14.3 | 14.4 | 14.2
| | S/N | 13.4 | 23.6 | 24.5
| | S/N(c) | 11.8 | 22.0 | 23.6
| | SN(E/C) 0.44
|
| 
| 
| 
| 
| 
|