| Red | Green | Blue | |
| z | 17.66 | ||
| znorm | Inf | ||
| sky | -Inf | -Inf | -Inf |
| S/N | 12.4 | 24.6 | 25.9 |
| S/N(c) | 0.0 | 0.0 | 0.0 |
| SN(E/C) |
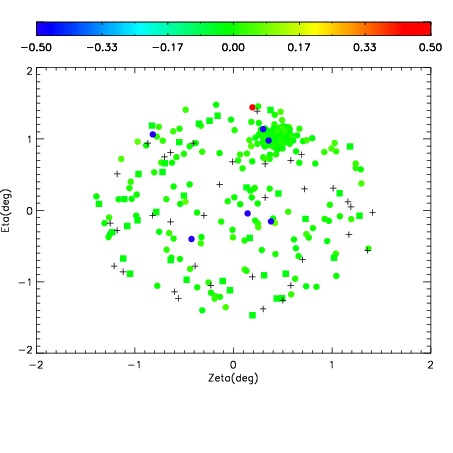
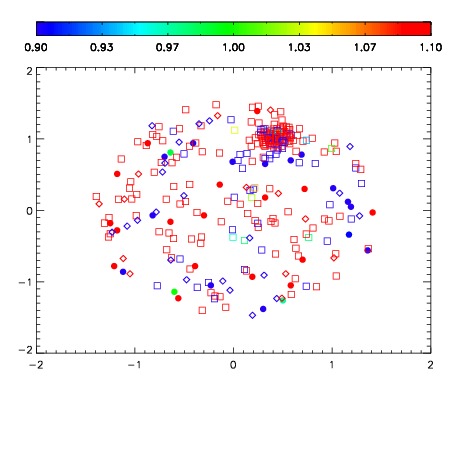
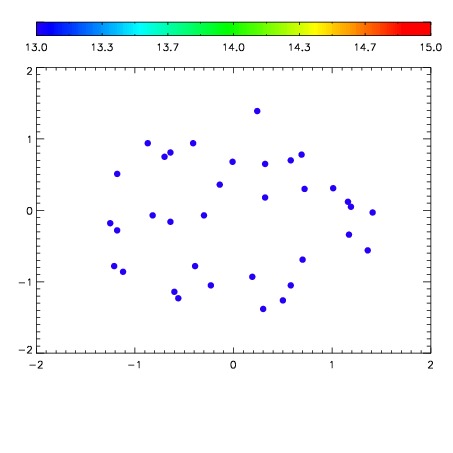

| Frame | Nreads | Zeropoints | Mag plots | Spatial mag deviation | Spatial sky 16325A emission deviations (filled: sky, open: star) | Spatial sky continuum emission | Spatial sky telluric CO2 absorption deviations (filled: H < 10) | |||||||||||||||||||||||
| 0 | 0 |
|
|
|
|
|
|
| IPAIR | NAME | SHIFT | NEWSHIFT | S/N | NAME | SHIFT | NEWSHIFT | S/N |
| 0 | 04040097 | 0.503721 | 0.00000 | 78.9936 | 04040102 | 0.00284947 | 0.500872 | 71.4761 |
| 1 | 04040105 | 0.501092 | 0.00262898 | 149.201 | 04040106 | 0.00268651 | 0.501034 | 172.495 |
| 2 | 04040104 | 0.500665 | 0.00305599 | 112.870 | 04040103 | 0.00332514 | 0.500396 | 78.5411 |
| 3 | 04040101 | 0.503107 | 0.000613987 | 77.7660 | 04040099 | 0.00128258 | 0.502438 | 66.4807 |
| 4 | 04040100 | 0.501200 | 0.00252098 | 49.3900 | 04040095 | 0.00000 | 0.503721 | 55.0046 |
| 5 | 04040096 | 0.503302 | 0.000419021 | 45.5640 | 04040098 | 0.00286797 | 0.500853 | 44.1109 |