| Red | Green | Blue | |
| z | 17.64 | ||
| znorm | Inf | ||
| sky | -Inf | -Inf | -Inf |
| S/N | 20.7 | 36.8 | 39.9 |
| S/N(c) | 0.0 | 0.0 | 0.0 |
| SN(E/C) |
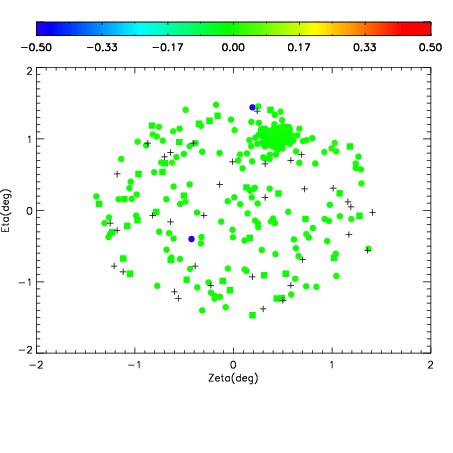
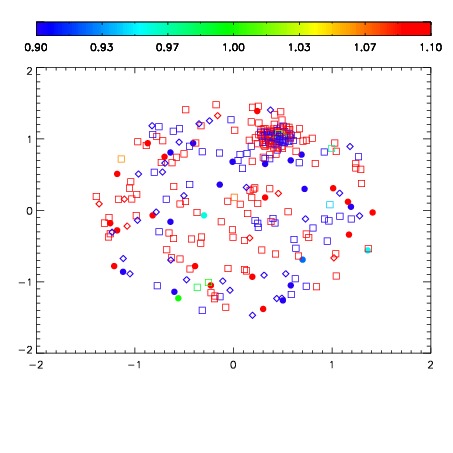
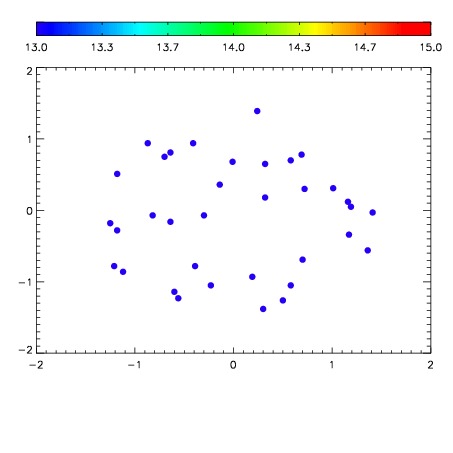

| Frame | Nreads | Zeropoints | Mag plots | Spatial mag deviation | Spatial sky 16325A emission deviations (filled: sky, open: star) | Spatial sky continuum emission | Spatial sky telluric CO2 absorption deviations (filled: H < 10) | |||||||||||||||||||||||
| 0 | 0 |
|
|
|
|
|
|
| IPAIR | NAME | SHIFT | NEWSHIFT | S/N | NAME | SHIFT | NEWSHIFT | S/N |
| 0 | 04620029 | 0.497273 | 0.00000 | 127.924 | 04620034 | 0.00176110 | 0.495512 | 148.763 |
| 1 | 04620032 | 0.494627 | 0.00264600 | 152.320 | 04620031 | 0.00237461 | 0.494898 | 163.793 |
| 2 | 04620033 | 0.495386 | 0.00188699 | 150.795 | 04620030 | 0.00129569 | 0.495977 | 156.329 |
| 3 | 04620028 | 0.494576 | 0.00269699 | 63.0182 | 04620027 | 0.00000 | 0.497273 | 135.990 |