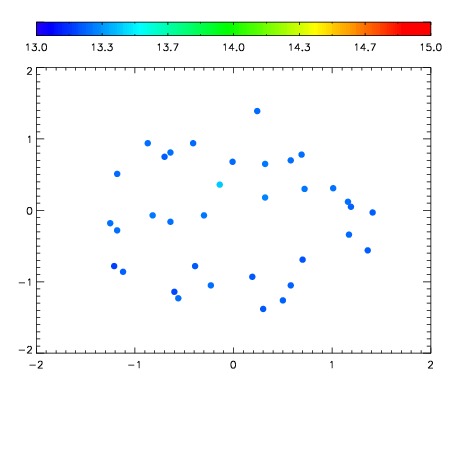
| Frame | Nreads | Zeropoints | Mag plots
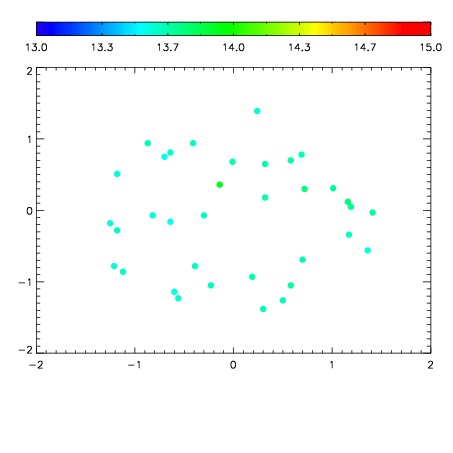
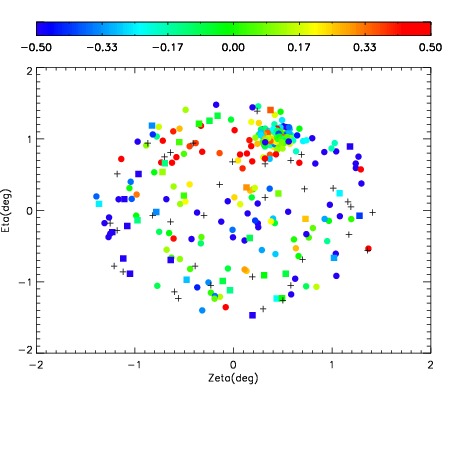
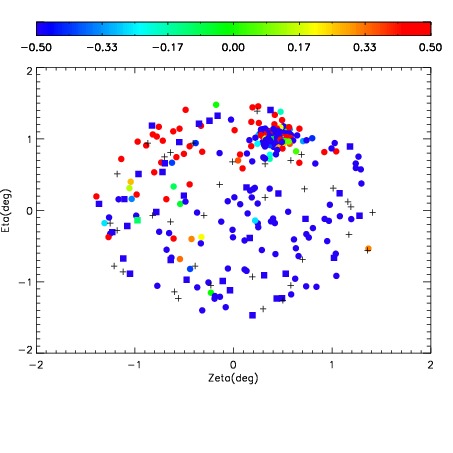
| Spatial mag deviation
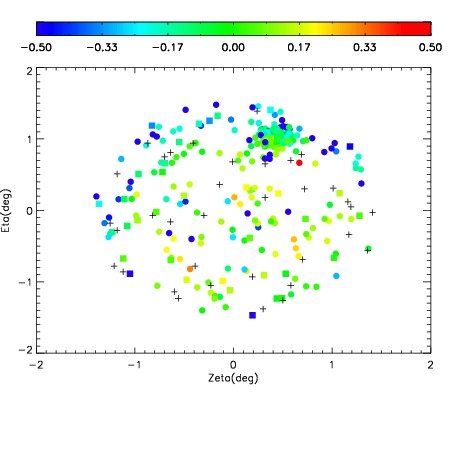
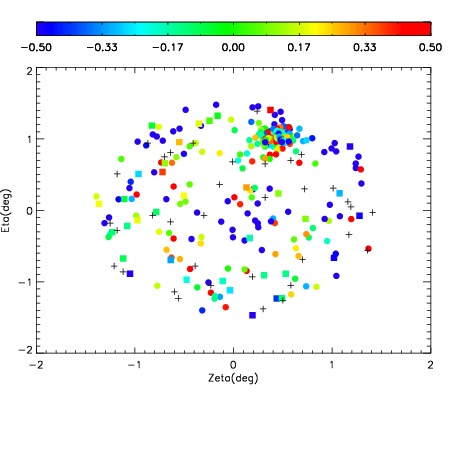
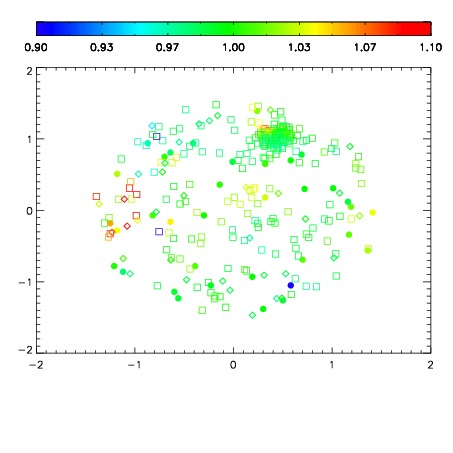
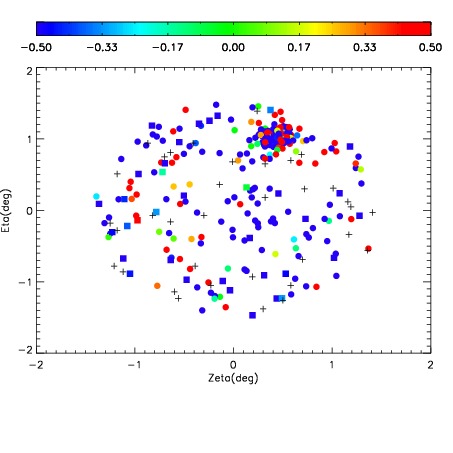
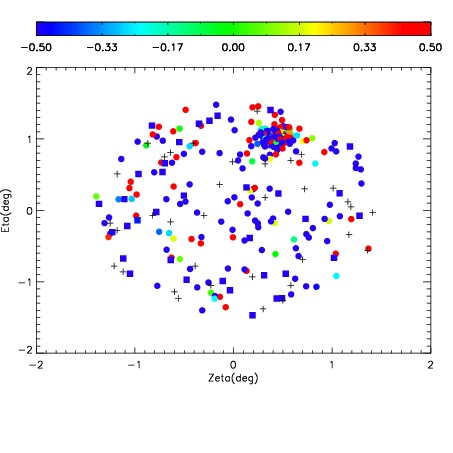
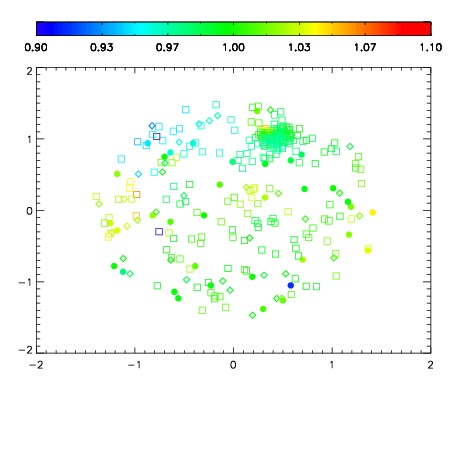
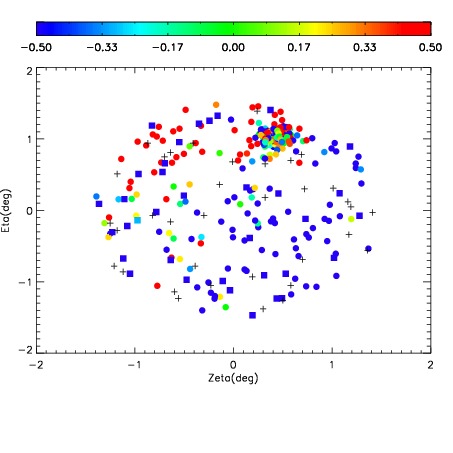
| Spatial sky 16325A emission deviations (filled: sky, open: star)
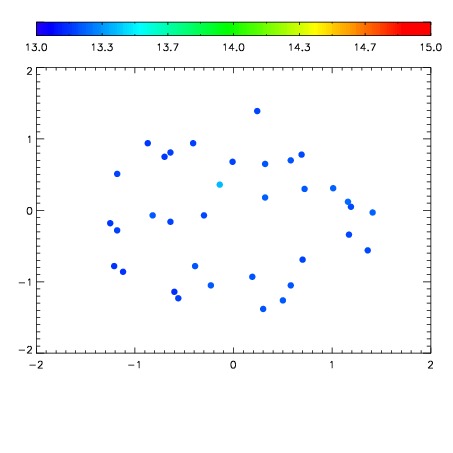
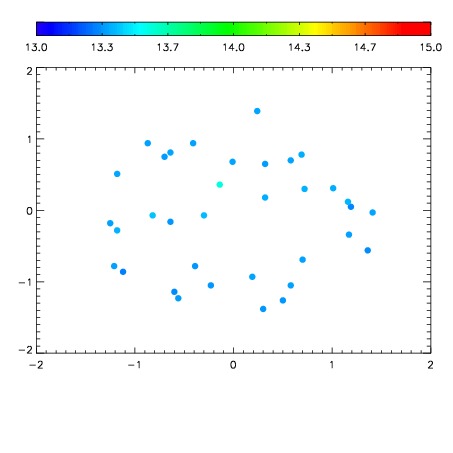
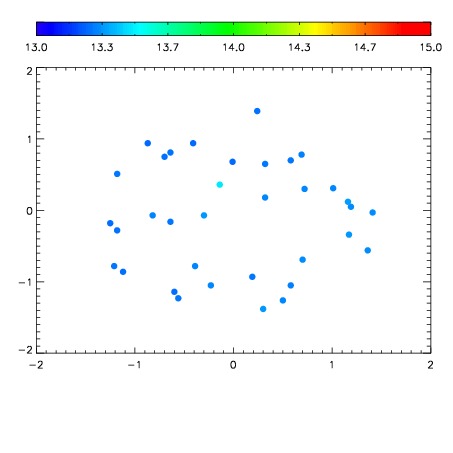
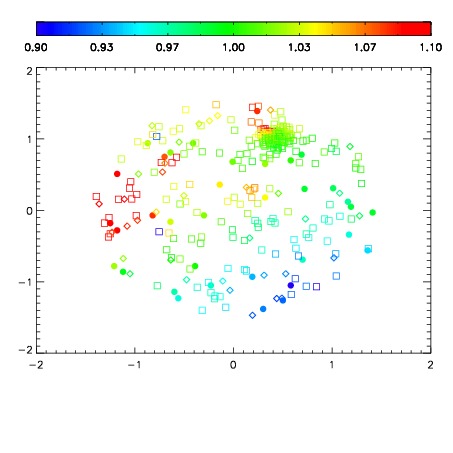
| Spatial sky continuum emission
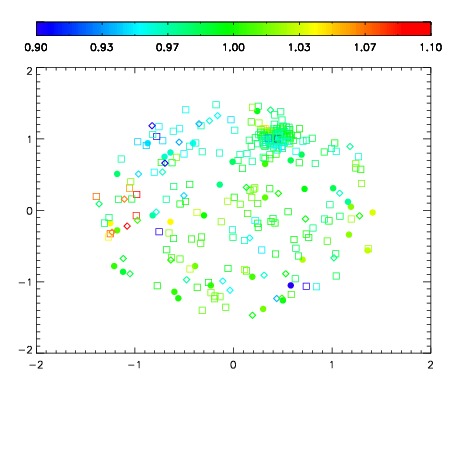
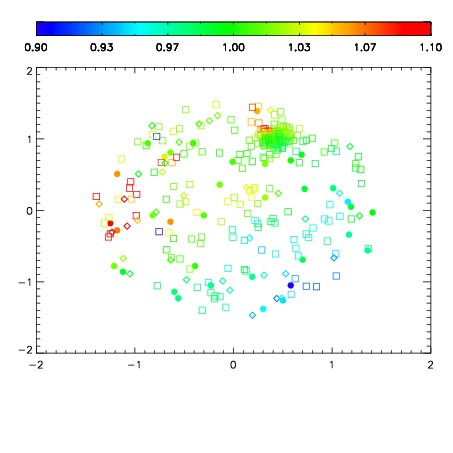
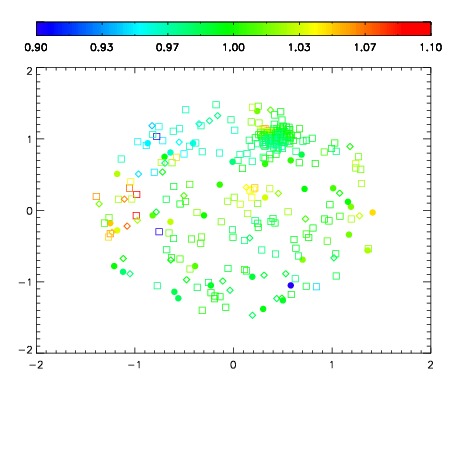
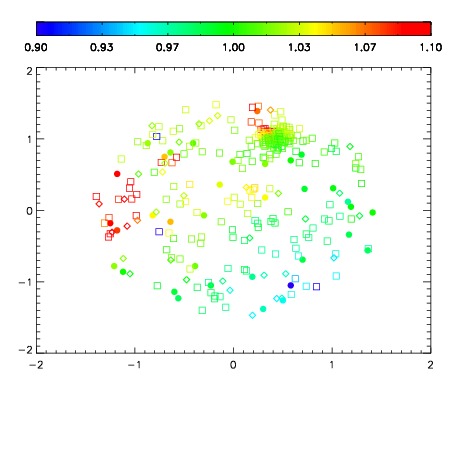
| Spatial sky telluric CO2 absorption deviations (filled: H < 10)
|
| 4880037
| 47
| | Red | Green | Blue
| | z | | 17.97
| | znorm | | 13.79
| | sky | 13.8 | 13.6 | 13.6
| | S/N | 6.3 | 12.4 | 12.7
| | S/N(c) | 5.4 | 11.3 | 12.7
| | SN(E/C) 0.61
|
| 
| 
| 
| 
| 
|
| 4880038
| 47
| | Red | Green | Blue
| | z | | 15.69
| | znorm | | 11.51
| | sky | 13.1 | 13.1 | 13.3
| | S/N | 0.6 | 1.9 | 0.8
| | S/N(c) | 0.8 | 1.9 | 2.1
| | SN(E/C) 0.99
|
| 
| 
| 
| 
| 
|
| 4880039
| 47
| | Red | Green | Blue
| | z | | 16.16
| | znorm | | 11.98
| | sky | 13.2 | 13.2 | 13.4
| | S/N | 1.2 | 2.8 | 1.6
| | S/N(c) | 0.0 | 0.0 | 0.0
| | SN(E/C) 0.91
|
| 
| 
| 
| 
| 
|
| 4880040
| 47
| | Red | Green | Blue
| | z | | 14.05
| | znorm | | 9.87
| | sky | 13.3 | 13.4 | 13.6
| | S/N | 0.1 | 0.3 | -0.9
| | S/N(c) | 0.0 | 0.0 | 0.0
| | SN(E/C) 3.81
|
| 
| 
| 
| 
| 
|
| 4880041
| 47
| | Red | Green | Blue
| | z | | 13.72
| | znorm | | 9.54
| | sky | 13.4 | 13.5 | 13.9
| | S/N | -0.1 | 0.2 | -0.9
| | S/N(c) | 0.0 | 0.0 | 0.0
| | SN(E/C)10.15
|
| 
| 
| 
| 
| 
|
| 4880042
| 47
| | Red | Green | Blue
| | z | | 14.04
| | znorm | | 9.86
| | sky | 13.2 | 13.3 | 13.6
| | S/N | 0.1 | 0.1 | -1.0
| | S/N(c) | 0.0 | 0.0 | 0.0
| | SN(E/C) 8.96
|
| 
| 
| 
| 
| 
|
| 4880043
| 47
| | Red | Green | Blue
| | z | | 15.51
| | znorm | | 11.33
| | sky | 13.2 | 13.3 | 13.6
| | S/N | 0.8 | 1.7 | 0.6
| | S/N(c) | 0.9 | 1.5 | 1.6
| | SN(E/C) 0.93
|
| 
| 
| 
| 
| 
|
| 4880044
| 47
| | Red | Green | Blue
| | z | | 15.22
| | znorm | | 11.04
| | sky | 13.5 | 13.6 | 14.0
| | S/N | 0.3 | 1.2 | -0.1
| | S/N(c) | 0.0 | 0.0 | 0.0
| | SN(E/C) 2.00
|
| 
| 
| 
| 
| 
|