| Red | Green | Blue | |
| z | 17.64 | ||
| znorm | Inf | ||
| sky | -Inf | -Inf | -Inf |
| S/N | 27.2 | 48.9 | 52.1 |
| S/N(c) | 0.0 | 0.0 | 0.0 |
| SN(E/C) |
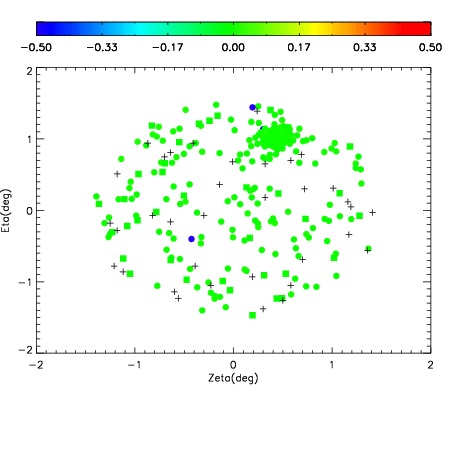
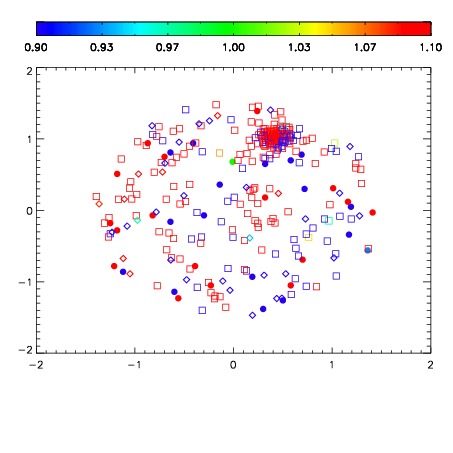
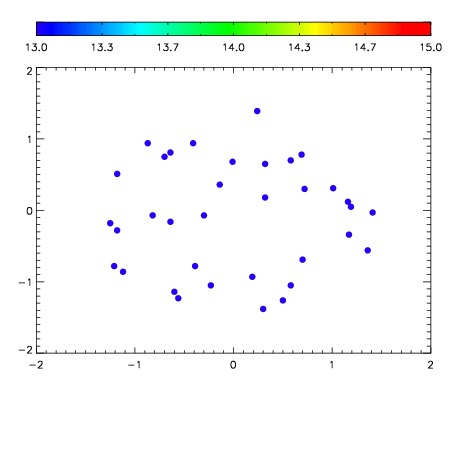

| Frame | Nreads | Zeropoints | Mag plots | Spatial mag deviation | Spatial sky 16325A emission deviations (filled: sky, open: star) | Spatial sky continuum emission | Spatial sky telluric CO2 absorption deviations (filled: H < 10) | |||||||||||||||||||||||
| 0 | 0 |
|
|
|
|
|
|
| IPAIR | NAME | SHIFT | NEWSHIFT | S/N | NAME | SHIFT | NEWSHIFT | S/N |
| 0 | 05160031 | 0.495584 | 0.00000 | 186.972 | 05160028 | 0.000123464 | 0.495461 | 184.423 |
| 1 | 05160026 | 0.494082 | 0.00150201 | 191.254 | 05160025 | 0.00000 | 0.495584 | 187.609 |
| 2 | 05160027 | 0.494320 | 0.00126401 | 189.658 | 05160032 | 0.00212798 | 0.493456 | 186.976 |
| 3 | 05160030 | 0.494728 | 0.000856012 | 186.354 | 05160029 | -0.000844492 | 0.496428 | 180.086 |