| Red | Green | Blue | |
| z | 17.64 | ||
| znorm | Inf | ||
| sky | -Inf | -Inf | -Inf |
| S/N | 29.8 | 51.8 | 56.0 |
| S/N(c) | 0.0 | 0.0 | 0.0 |
| SN(E/C) |
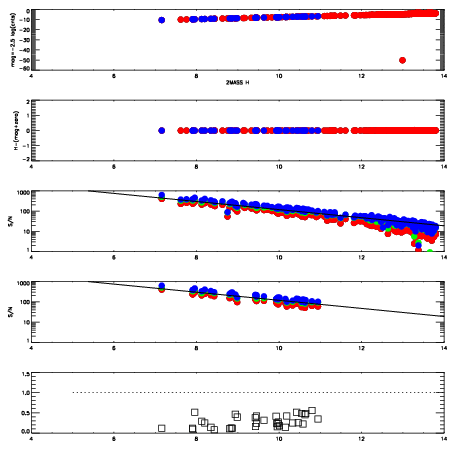
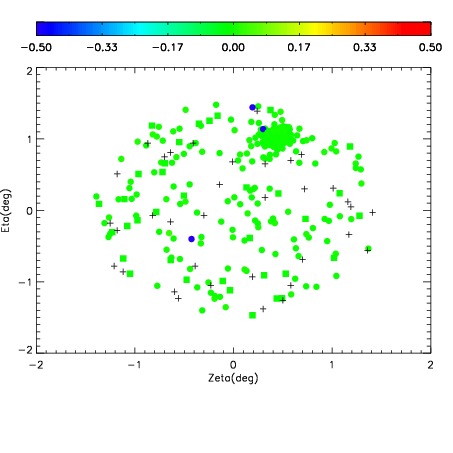
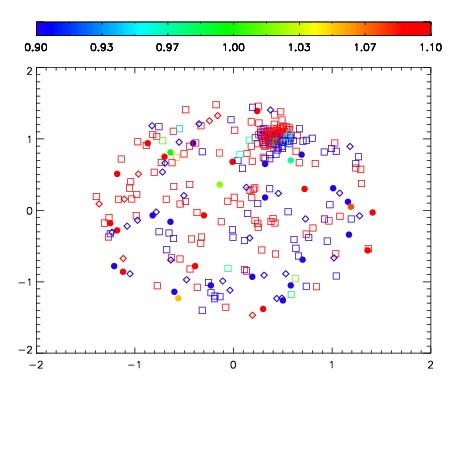
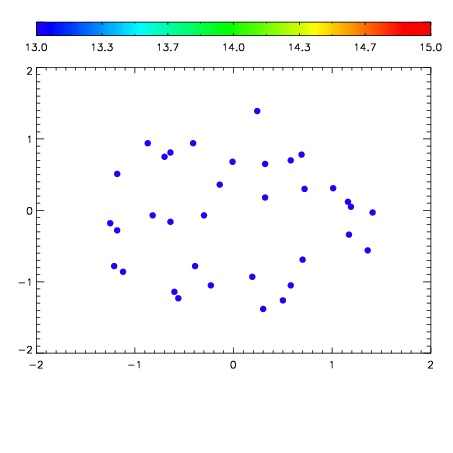

| Frame | Nreads | Zeropoints | Mag plots | Spatial mag deviation | Spatial sky 16325A emission deviations (filled: sky, open: star) | Spatial sky continuum emission | Spatial sky telluric CO2 absorption deviations (filled: H < 10) | |||||||||||||||||||||||
| 0 | 0 |
|
|
|
|
|
|
| IPAIR | NAME | SHIFT | NEWSHIFT | S/N | NAME | SHIFT | NEWSHIFT | S/N |
| 0 | 05200031 | 0.492424 | 0.00000 | 163.756 | 05200032 | -0.000187578 | 0.492612 | 162.531 |
| 1 | 05200030 | 0.491929 | 0.000495017 | 164.877 | 05200029 | 0.00312729 | 0.489297 | 165.171 |
| 2 | 05200027 | 0.489634 | 0.00279000 | 164.700 | 05200028 | 0.00203832 | 0.490386 | 164.901 |
| 3 | 05200026 | 0.489109 | 0.00331500 | 162.343 | 05200025 | 0.00000 | 0.492424 | 154.583 |