| Red | Green | Blue | |
| z | 17.64 | ||
| znorm | Inf | ||
| sky | -Inf | -Inf | -Inf |
| S/N | 25.7 | 44.8 | 53.1 |
| S/N(c) | 0.0 | 0.0 | 0.0 |
| SN(E/C) |
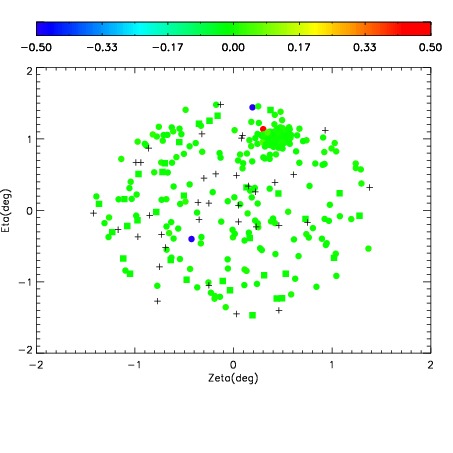
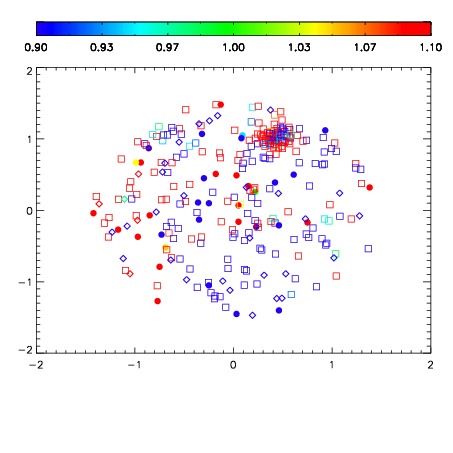
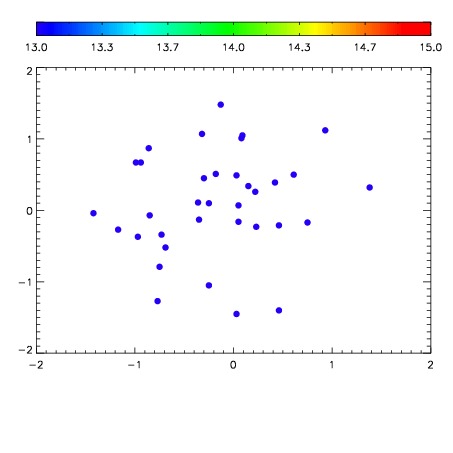

| Frame | Nreads | Zeropoints | Mag plots | Spatial mag deviation | Spatial sky 16325A emission deviations (filled: sky, open: star) | Spatial sky continuum emission | Spatial sky telluric CO2 absorption deviations (filled: H < 10) | |||||||||||||||||||||||
| 0 | 0 |
|
|
|
|
|
|
| IPAIR | NAME | SHIFT | NEWSHIFT | S/N | NAME | SHIFT | NEWSHIFT | S/N |
| 0 | 04050099 | 0.501210 | 0.00000 | 147.074 | 04050101 | 0.000174062 | 0.501036 | 149.153 |
| 1 | 04050102 | 0.499649 | 0.00156099 | 147.067 | 04050100 | 0.00103060 | 0.500179 | 147.072 |
| 2 | 04050098 | 0.500738 | 0.000471950 | 144.913 | 04050097 | 0.00000 | 0.501210 | 145.974 |
| 3 | 04050103 | 0.500502 | 0.000707984 | 144.159 | 04050104 | 0.00316592 | 0.498044 | 141.009 |