| Red | Green | Blue | |
| z | 17.64 | ||
| znorm | Inf | ||
| sky | -Inf | -Inf | -Inf |
| S/N | 30.2 | 53.1 | 57.0 |
| S/N(c) | 0.0 | 0.0 | 0.0 |
| SN(E/C) |

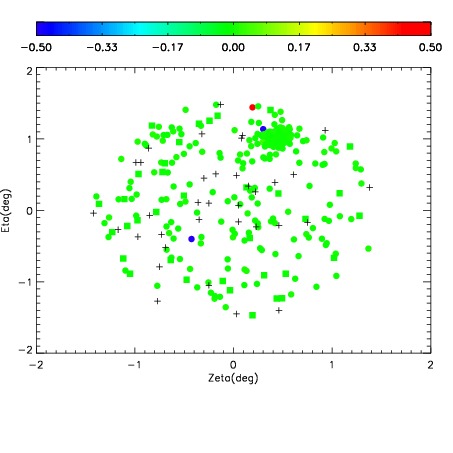
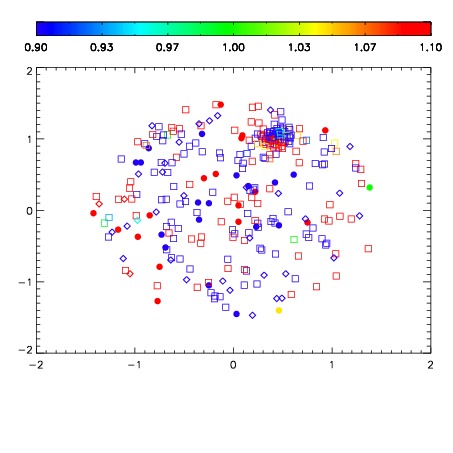


| Frame | Nreads | Zeropoints | Mag plots | Spatial mag deviation | Spatial sky 16325A emission deviations (filled: sky, open: star) | Spatial sky continuum emission | Spatial sky telluric CO2 absorption deviations (filled: H < 10) | |||||||||||||||||||||||
| 0 | 0 |
|
|
|
|
|
|
| IPAIR | NAME | SHIFT | NEWSHIFT | S/N | NAME | SHIFT | NEWSHIFT | S/N |
| 0 | 04890053 | 0.494299 | 0.00000 | 91.6350 | 04890051 | 0.00000 | 0.494299 | 91.9168 |
| 1 | 04890056 | 0.493352 | 0.000946999 | 89.6528 | 04890055 | 0.00726151 | 0.487037 | 89.5510 |
| 2 | 04890052 | 0.493755 | 0.000543982 | 89.3841 | 04890054 | 0.00986014 | 0.484439 | 89.1696 |
| 3 | 04890057 | 0.494174 | 0.000124991 | 88.5372 | 04890058 | 0.00402091 | 0.490278 | 88.4560 |