| Red | Green | Blue | |
| z | 17.64 | ||
| znorm | Inf | ||
| sky | -Inf | -Inf | -Inf |
| S/N | 24.9 | 44.5 | 47.7 |
| S/N(c) | 0.0 | 0.0 | 0.0 |
| SN(E/C) |

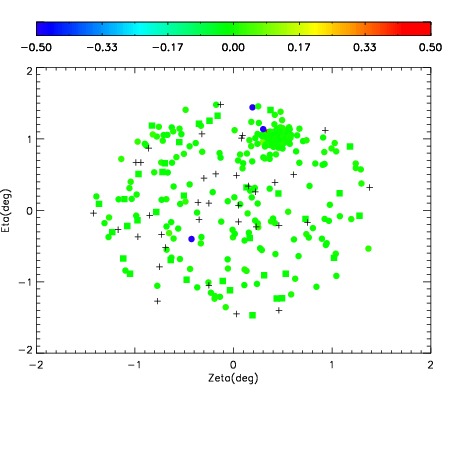
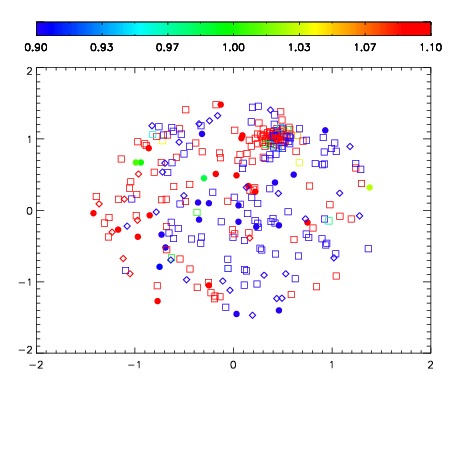


| Frame | Nreads | Zeropoints | Mag plots | Spatial mag deviation | Spatial sky 16325A emission deviations (filled: sky, open: star) | Spatial sky continuum emission | Spatial sky telluric CO2 absorption deviations (filled: H < 10) | |||||||||||||||||||||||
| 0 | 0 |
|
|
|
|
|
|
| IPAIR | NAME | SHIFT | NEWSHIFT | S/N | NAME | SHIFT | NEWSHIFT | S/N |
| 0 | 05180028 | 0.497241 | 0.00000 | 154.459 | 05180029 | 0.00225862 | 0.494982 | 154.126 |
| 1 | 05180027 | 0.495711 | 0.00152999 | 157.615 | 05180025 | -0.000672538 | 0.497914 | 161.990 |
| 2 | 05180024 | 0.495319 | 0.00192198 | 156.556 | 05180026 | 0.000985205 | 0.496256 | 160.921 |
| 3 | 05180023 | 0.494611 | 0.00263000 | 151.761 | 05180022 | 0.00000 | 0.497241 | 153.059 |