| Red | Green | Blue | |
| z | 17.64 | ||
| znorm | Inf | ||
| sky | -Inf | -NaN | -Inf |
| S/N | 23.3 | 40.1 | 46.5 |
| S/N(c) | 0.0 | 0.0 | 0.0 |
| SN(E/C) |
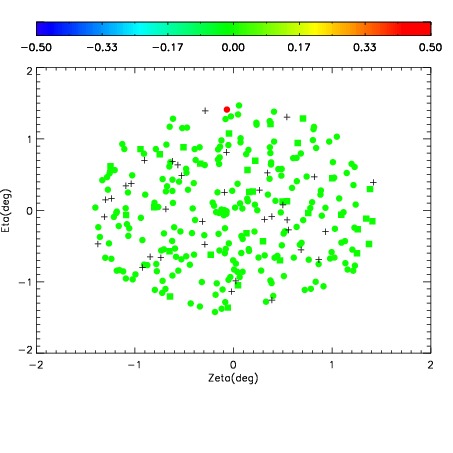
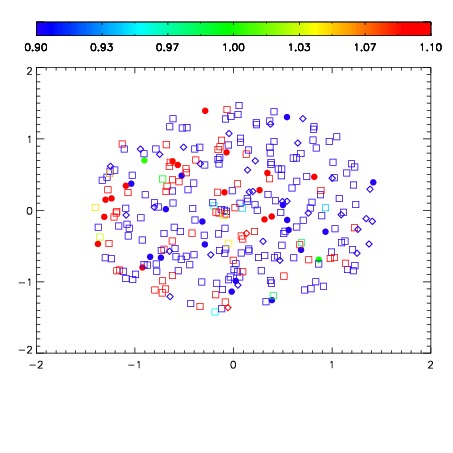
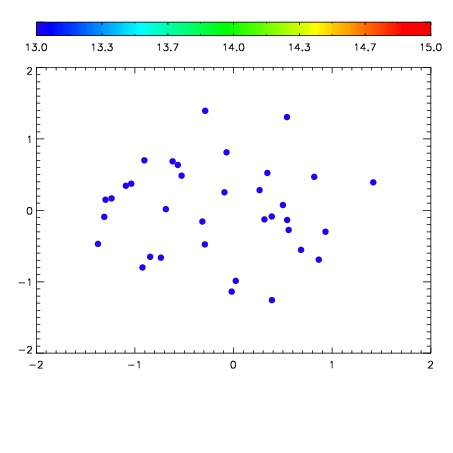

| Frame | Nreads | Zeropoints | Mag plots | Spatial mag deviation | Spatial sky 16325A emission deviations (filled: sky, open: star) | Spatial sky continuum emission | Spatial sky telluric CO2 absorption deviations (filled: H < 10) | |||||||||||||||||||||||
| 0 | 0 |
|
|
|
|
|
|
| IPAIR | NAME | SHIFT | NEWSHIFT | S/N | NAME | SHIFT | NEWSHIFT | S/N |
| 0 | 04300049 | 0.495506 | 0.00000 | 201.225 | 04300050 | 0.000620336 | 0.494886 | 207.464 |
| 1 | 04300052 | 0.491280 | 0.00422600 | 191.955 | 04300051 | -0.00101992 | 0.496526 | 193.717 |
| 2 | 04300048 | 0.491285 | 0.00422099 | 168.686 | 04300047 | 0.00000 | 0.495506 | 156.089 |