| Red | Green | Blue | |
| z | 17.64 | ||
| znorm | Inf | ||
| sky | -Inf | -Inf | -Inf |
| S/N | 31.8 | 51.8 | 58.6 |
| S/N(c) | 0.0 | 0.0 | 0.0 |
| SN(E/C) |
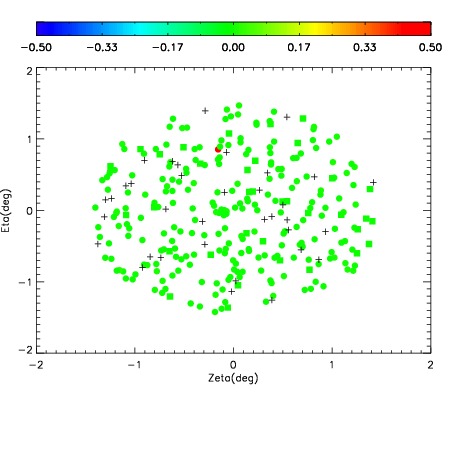
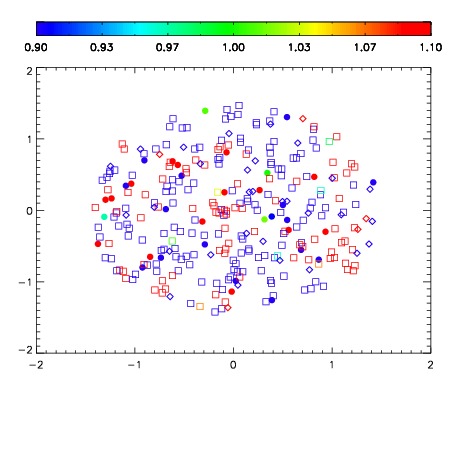


| Frame | Nreads | Zeropoints | Mag plots | Spatial mag deviation | Spatial sky 16325A emission deviations (filled: sky, open: star) | Spatial sky continuum emission | Spatial sky telluric CO2 absorption deviations (filled: H < 10) | |||||||||||||||||||||||
| 0 | 0 |
|
|
|
|
|
|
| IPAIR | NAME | SHIFT | NEWSHIFT | S/N | NAME | SHIFT | NEWSHIFT | S/N |
| 0 | 04610023 | 0.498030 | 0.00000 | 198.468 | 04610024 | 0.000896786 | 0.497133 | 200.905 |
| 1 | 04610026 | 0.492931 | 0.00509900 | 200.532 | 04610025 | 0.00104977 | 0.496980 | 201.073 |
| 2 | 04610027 | 0.497526 | 0.000504017 | 197.219 | 04610028 | 0.00362621 | 0.494404 | 198.964 |
| 3 | 04610022 | 0.495516 | 0.00251400 | 189.378 | 04610021 | 0.00000 | 0.498030 | 187.202 |