| Red | Green | Blue | |
| z | 17.64 | ||
| znorm | Inf | ||
| sky | -Inf | -Inf | -Inf |
| S/N | 28.2 | 48.3 | 53.3 |
| S/N(c) | 0.0 | 0.0 | 0.0 |
| SN(E/C) |
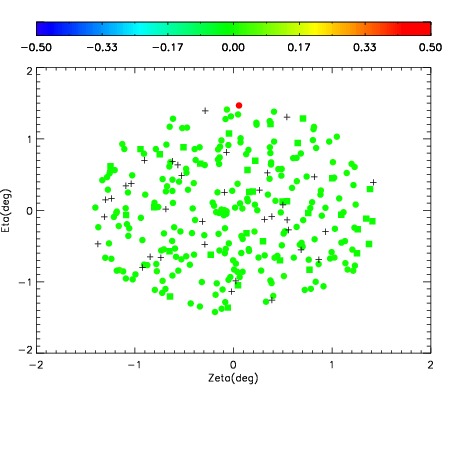
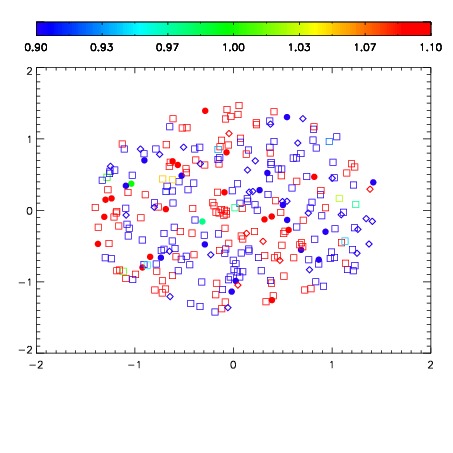
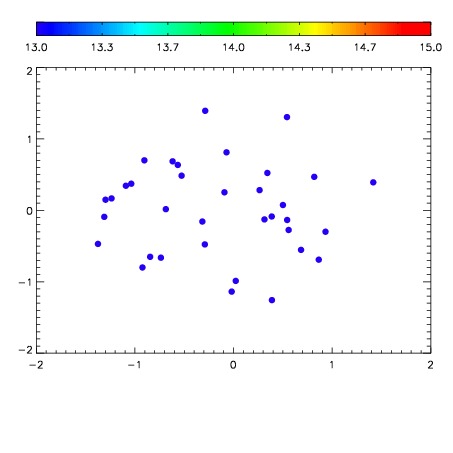

| Frame | Nreads | Zeropoints | Mag plots | Spatial mag deviation | Spatial sky 16325A emission deviations (filled: sky, open: star) | Spatial sky continuum emission | Spatial sky telluric CO2 absorption deviations (filled: H < 10) | |||||||||||||||||||||||
| 0 | 0 |
|
|
|
|
|
|
| IPAIR | NAME | SHIFT | NEWSHIFT | S/N | NAME | SHIFT | NEWSHIFT | S/N |
| 0 | 04670042 | 0.496551 | 0.00000 | 194.729 | 04670043 | -0.00107521 | 0.497626 | 188.340 |
| 1 | 04670038 | 0.494825 | 0.00172600 | 201.793 | 04670039 | 0.00197005 | 0.494581 | 195.282 |
| 2 | 04670037 | 0.494400 | 0.00215101 | 199.764 | 04670040 | 0.000825831 | 0.495725 | 192.737 |
| 3 | 04670041 | 0.496440 | 0.000111014 | 187.572 | 04670036 | 0.00000 | 0.496551 | 185.790 |