| Red | Green | Blue | |
| z | 17.64 | ||
| znorm | Inf | ||
| sky | -Inf | -Inf | -Inf |
| S/N | 27.9 | 48.6 | 54.2 |
| S/N(c) | 0.0 | 0.0 | 0.0 |
| SN(E/C) |
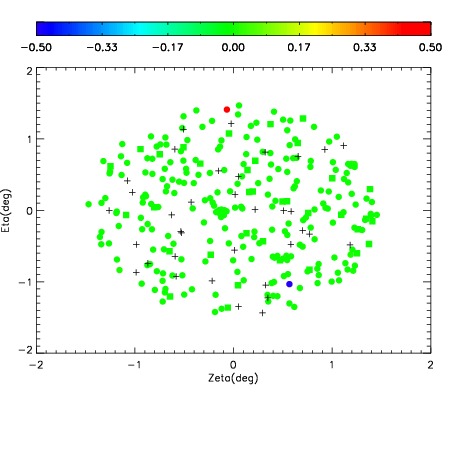
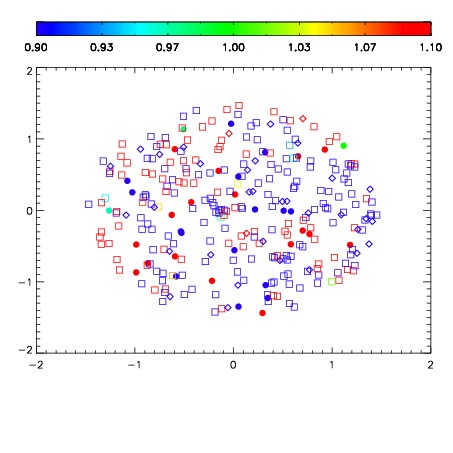
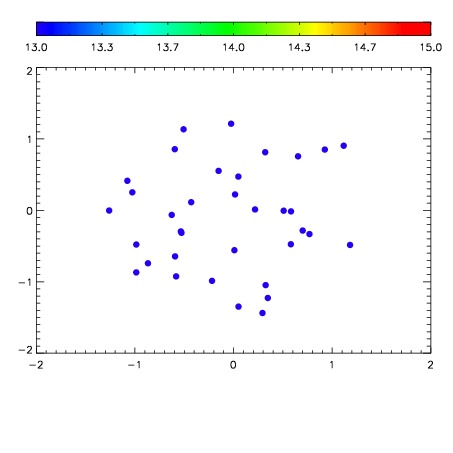

| Frame | Nreads | Zeropoints | Mag plots | Spatial mag deviation | Spatial sky 16325A emission deviations (filled: sky, open: star) | Spatial sky continuum emission | Spatial sky telluric CO2 absorption deviations (filled: H < 10) | |||||||||||||||||||||||
| 0 | 0 |
|
|
|
|
|
|
| IPAIR | NAME | SHIFT | NEWSHIFT | S/N | NAME | SHIFT | NEWSHIFT | S/N |
| 0 | 04620040 | 0.494889 | 0.00000 | 149.817 | 04620041 | 0.00237680 | 0.492512 | 155.361 |
| 1 | 04620043 | 0.491554 | 0.00333500 | 179.289 | 04620045 | -0.00114868 | 0.496038 | 176.508 |
| 2 | 04620044 | 0.492543 | 0.00234598 | 174.218 | 04620038 | 0.00000 | 0.494889 | 175.473 |
| 3 | 04620047 | 0.490869 | 0.00402001 | 172.523 | 04620046 | -0.00216257 | 0.497052 | 174.813 |
| 4 | 04620039 | 0.494122 | 0.000766993 | 154.318 | 04620042 | -0.000160999 | 0.495050 | 174.035 |