| Red | Green | Blue | |
| z | 17.64 | ||
| znorm | Inf | ||
| sky | -Inf | -Inf | -Inf |
| S/N | 16.8 | 33.0 | 36.1 |
| S/N(c) | 0.0 | 0.0 | 0.0 |
| SN(E/C) |
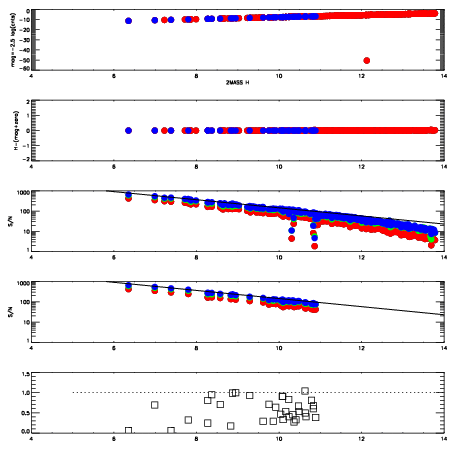
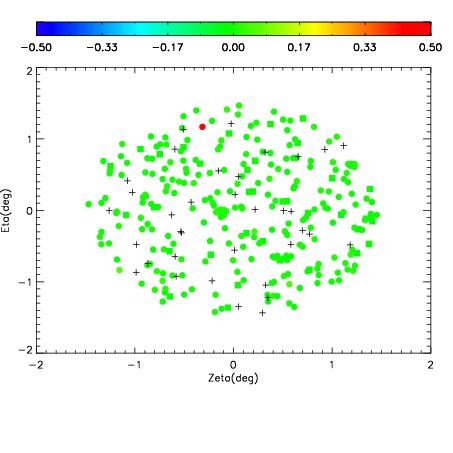
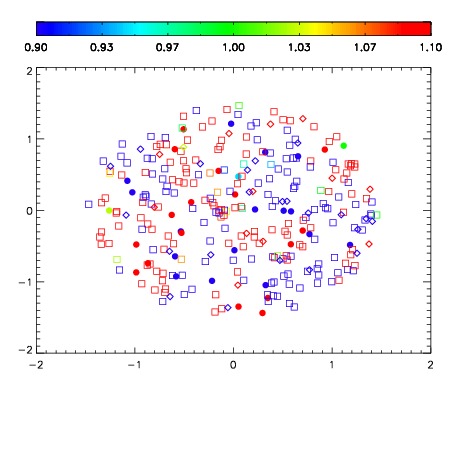
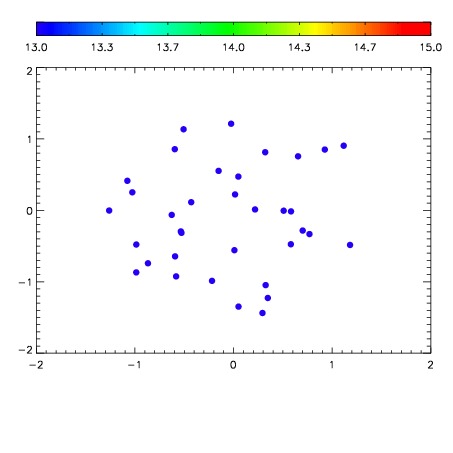

| Frame | Nreads | Zeropoints | Mag plots | Spatial mag deviation | Spatial sky 16325A emission deviations (filled: sky, open: star) | Spatial sky continuum emission | Spatial sky telluric CO2 absorption deviations (filled: H < 10) | |||||||||||||||||||||||
| 0 | 0 |
|
|
|
|
|
|
| IPAIR | NAME | SHIFT | NEWSHIFT | S/N | NAME | SHIFT | NEWSHIFT | S/N |
| 0 | 07880049 | 0.474645 | 0.00000 | 128.069 | 07880043 | 0.00410087 | 0.470544 | 131.571 |
| 1 | 07880041 | 0.472112 | 0.00253299 | 172.105 | 07880046 | 0.00521727 | 0.469428 | 163.335 |
| 2 | 07880044 | 0.472786 | 0.00185898 | 163.011 | 07880042 | 0.00372323 | 0.470922 | 155.507 |
| 3 | 07880045 | 0.472808 | 0.00183699 | 161.669 | 07880050 | 0.00525393 | 0.469391 | 146.203 |
| 4 | 07880040 | 0.472482 | 0.00216299 | 146.615 | 07880047 | 0.00470507 | 0.469940 | 144.540 |
| 5 | 07880048 | 0.474177 | 0.000467986 | 143.523 | 07880039 | 0.00000 | 0.474645 | 134.262 |