| Red | Green | Blue | |
| z | 17.64 | ||
| znorm | Inf | ||
| sky | -Inf | -Inf | -Inf |
| S/N | 23.7 | 39.2 | 43.0 |
| S/N(c) | 0.0 | 0.0 | 0.0 |
| SN(E/C) |
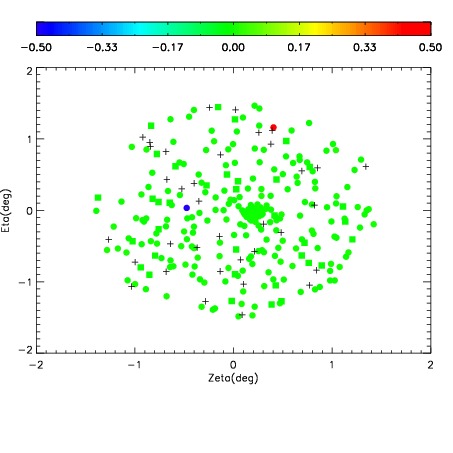

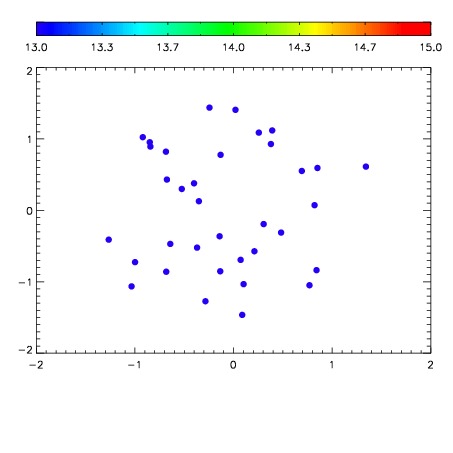

| Frame | Nreads | Zeropoints | Mag plots | Spatial mag deviation | Spatial sky 16325A emission deviations (filled: sky, open: star) | Spatial sky continuum emission | Spatial sky telluric CO2 absorption deviations (filled: H < 10) | |||||||||||||||||||||||
| 0 | 0 |
|
|
|
|
|
|
| IPAIR | NAME | SHIFT | NEWSHIFT | S/N | NAME | SHIFT | NEWSHIFT | S/N |
| 0 | 04300042 | 0.494557 | 0.00000 | 179.791 | 04300043 | 0.000397776 | 0.494159 | 211.492 |
| 1 | 04300037 | 0.492822 | 0.00173500 | 163.639 | 04300040 | -0.00111738 | 0.495674 | 194.656 |
| 2 | 04300038 | 0.494262 | 0.000294983 | 148.236 | 04300039 | 0.00149580 | 0.493061 | 194.050 |
| 3 | 04300041 | 0.492328 | 0.00222901 | 58.3681 | 04300036 | 0.00000 | 0.494557 | 182.906 |