| Red | Green | Blue | |
| z | 17.64 | ||
| znorm | Inf | ||
| sky | -Inf | -Inf | -Inf |
| S/N | 38.5 | 63.4 | 69.9 |
| S/N(c) | 0.0 | 0.0 | 0.0 |
| SN(E/C) |
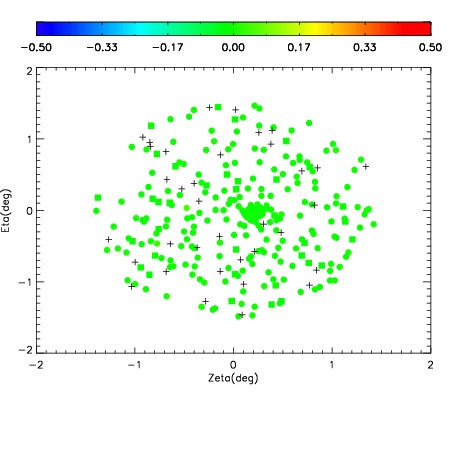
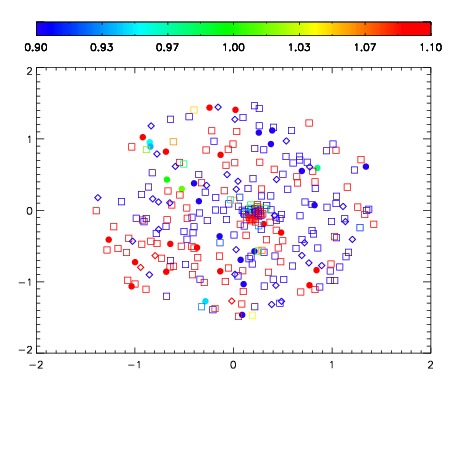
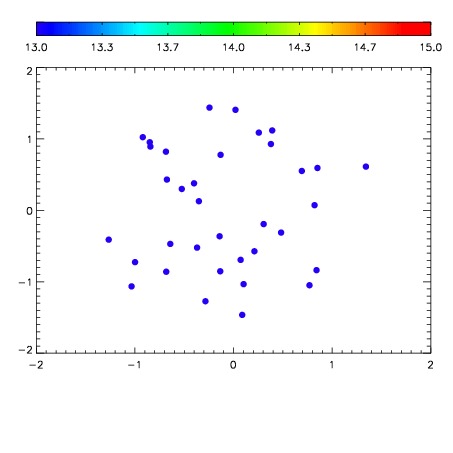

| Frame | Nreads | Zeropoints | Mag plots | Spatial mag deviation | Spatial sky 16325A emission deviations (filled: sky, open: star) | Spatial sky continuum emission | Spatial sky telluric CO2 absorption deviations (filled: H < 10) | |||||||||||||||||||||||
| 0 | 0 |
|
|
|
|
|
|
| IPAIR | NAME | SHIFT | NEWSHIFT | S/N | NAME | SHIFT | NEWSHIFT | S/N |
| 0 | 04370049 | 0.497680 | 0.00000 | 211.705 | 04370051 | -0.000620564 | 0.498301 | 215.628 |
| 1 | 04370056 | 0.492516 | 0.00516400 | 217.187 | 04370055 | -0.00109606 | 0.498776 | 216.638 |
| 2 | 04370053 | 0.493964 | 0.00371602 | 213.439 | 04370054 | 0.000471849 | 0.497208 | 216.434 |
| 3 | 04370048 | 0.495544 | 0.00213602 | 211.676 | 04370047 | 0.00000 | 0.497680 | 213.043 |
| 4 | 04370052 | 0.491697 | 0.00598300 | 211.562 | 04370050 | 0.00120096 | 0.496479 | 212.592 |