| Red | Green | Blue | |
| z | 17.64 | ||
| znorm | Inf | ||
| sky | -Inf | -Inf | -Inf |
| S/N | 32.3 | 55.2 | 59.5 |
| S/N(c) | 0.0 | 0.0 | 0.0 |
| SN(E/C) |
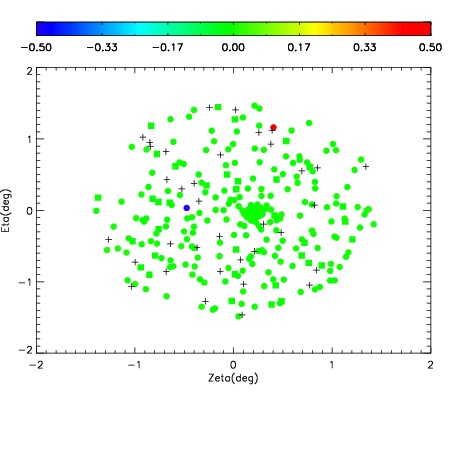
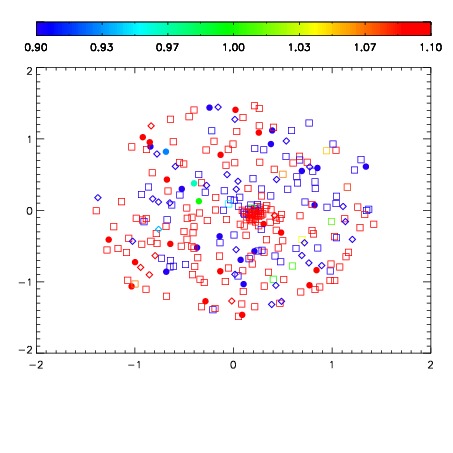
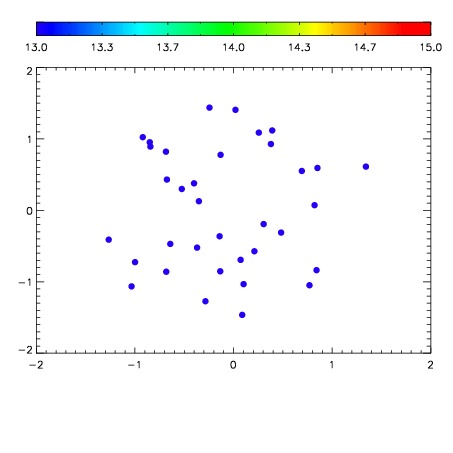

| Frame | Nreads | Zeropoints | Mag plots | Spatial mag deviation | Spatial sky 16325A emission deviations (filled: sky, open: star) | Spatial sky continuum emission | Spatial sky telluric CO2 absorption deviations (filled: H < 10) | |||||||||||||||||||||||
| 0 | 0 |
|
|
|
|
|
|
| IPAIR | NAME | SHIFT | NEWSHIFT | S/N | NAME | SHIFT | NEWSHIFT | S/N |
| 0 | 04600071 | 0.499551 | 0.00000 | 219.840 | 04600076 | 0.00145403 | 0.498097 | 225.171 |
| 1 | 04600075 | 0.499321 | 0.000229985 | 219.779 | 04600069 | 0.00000 | 0.499551 | 219.027 |
| 2 | 04600074 | 0.495878 | 0.00367299 | 219.721 | 04600073 | -0.000522668 | 0.500074 | 216.319 |
| 3 | 04600070 | 0.495798 | 0.00375301 | 217.022 | 04600072 | 0.000817620 | 0.498733 | 210.907 |