| Red | Green | Blue | |
| z | 17.64 | ||
| znorm | Inf | ||
| sky | -Inf | -Inf | -Inf |
| S/N | 31.5 | 54.3 | 57.2 |
| S/N(c) | 0.0 | 0.0 | 0.0 |
| SN(E/C) |
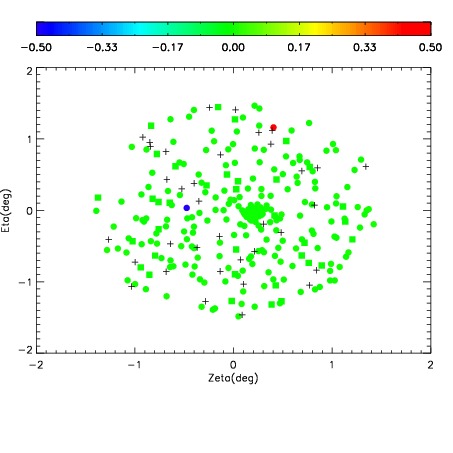
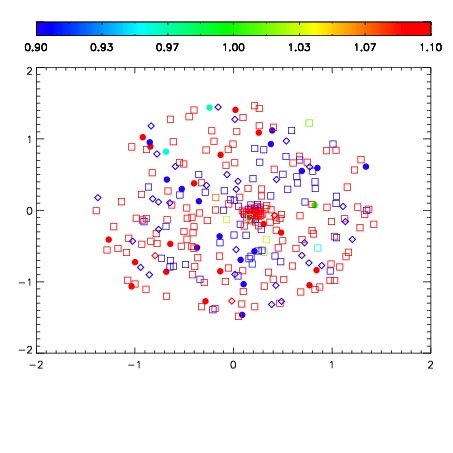
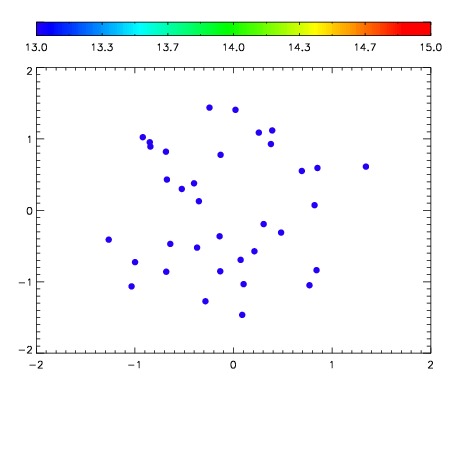

| Frame | Nreads | Zeropoints | Mag plots | Spatial mag deviation | Spatial sky 16325A emission deviations (filled: sky, open: star) | Spatial sky continuum emission | Spatial sky telluric CO2 absorption deviations (filled: H < 10) | |||||||||||||||||||||||
| 0 | 0 |
|
|
|
|
|
|
| IPAIR | NAME | SHIFT | NEWSHIFT | S/N | NAME | SHIFT | NEWSHIFT | S/N |
| 0 | 04610012 | 0.505410 | 0.00000 | 209.179 | 04610013 | 0.00192081 | 0.503489 | 209.500 |
| 1 | 04610016 | 0.495416 | 0.00999403 | 216.367 | 04610017 | -0.000486997 | 0.505897 | 216.819 |
| 2 | 04610015 | 0.495248 | 0.0101620 | 214.663 | 04610014 | -9.82496e-05 | 0.505508 | 212.734 |
| 3 | 04610011 | 0.495333 | 0.0100770 | 208.433 | 04610010 | 0.00000 | 0.505410 | 208.325 |