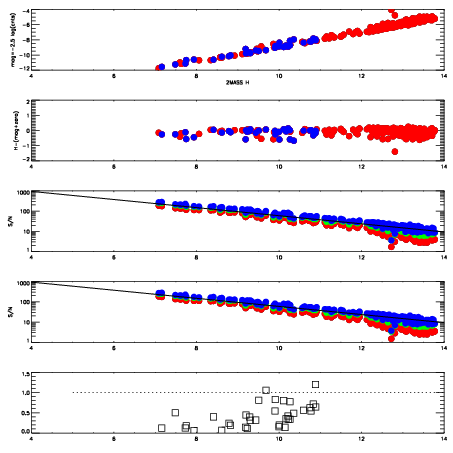
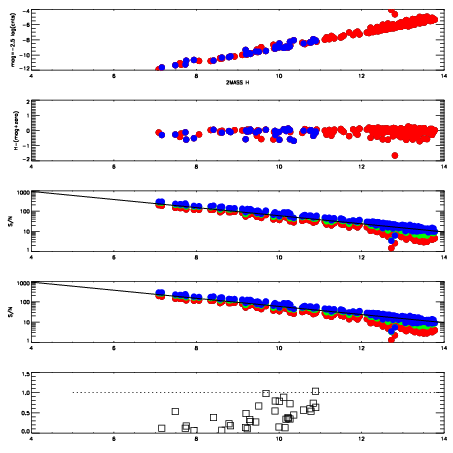
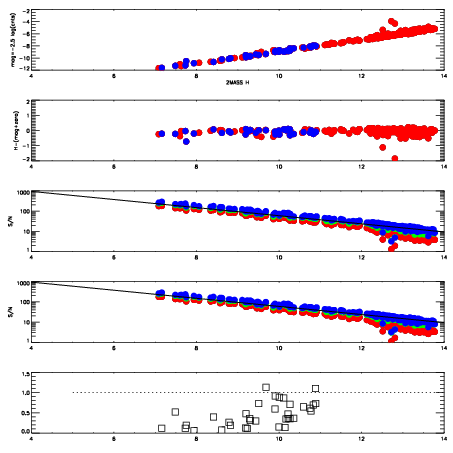
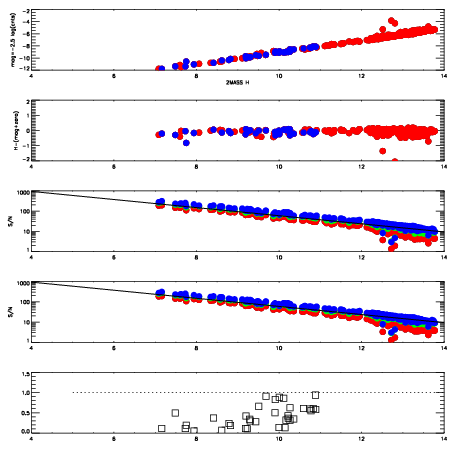
| Frame | Nreads | Zeropoints | Mag plots
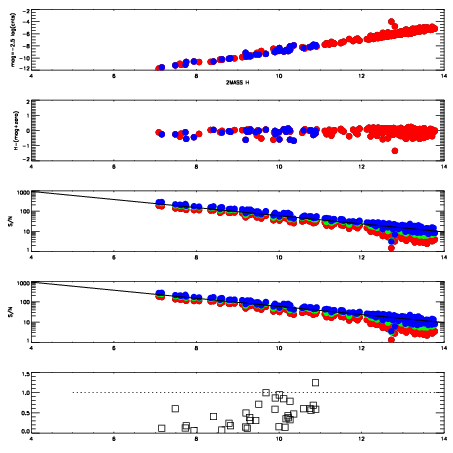
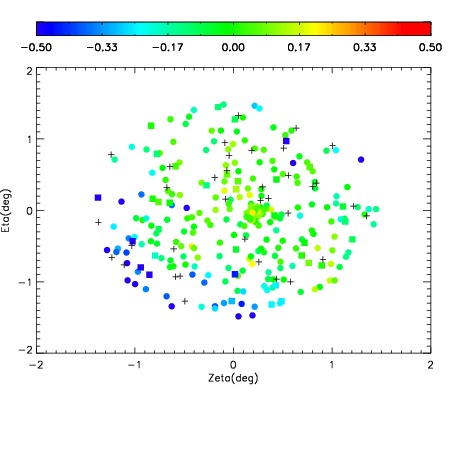
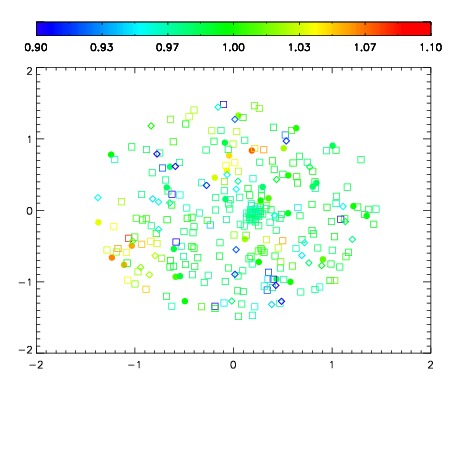
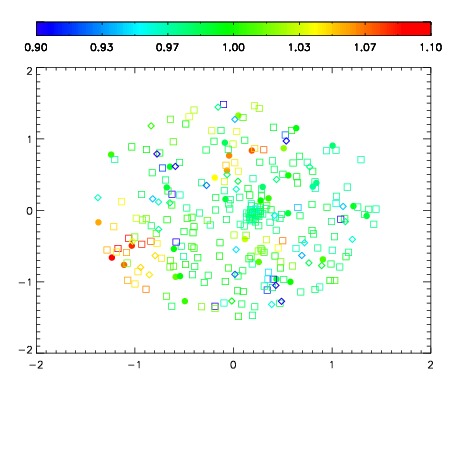
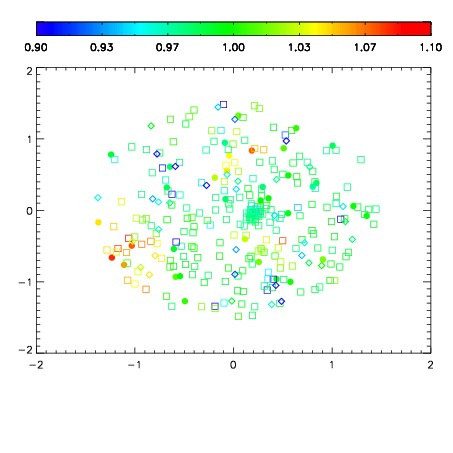
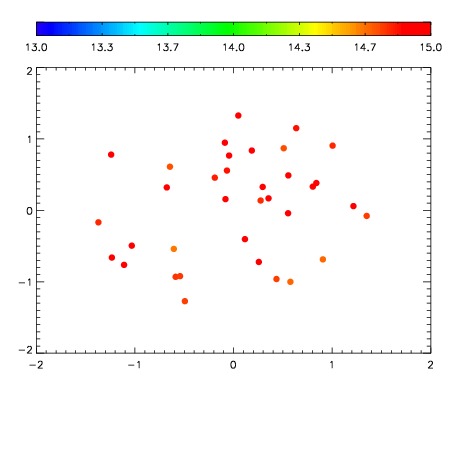
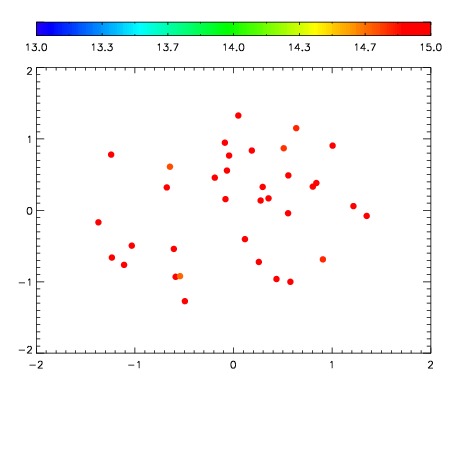
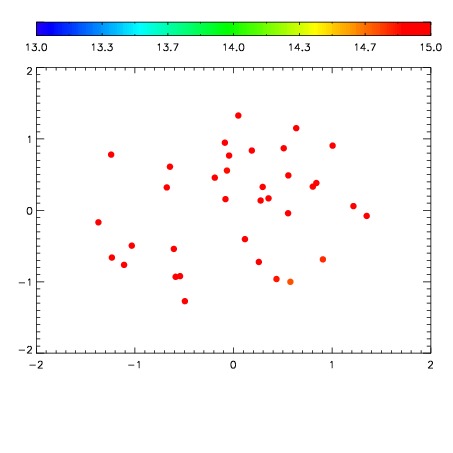
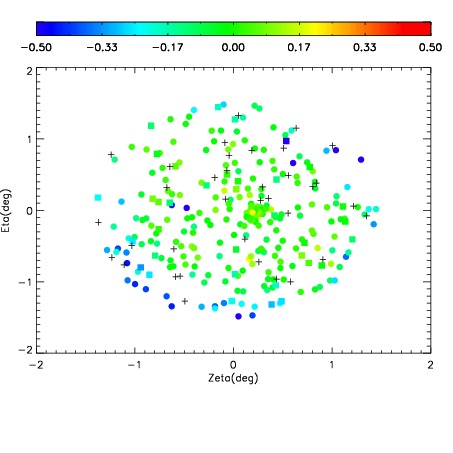
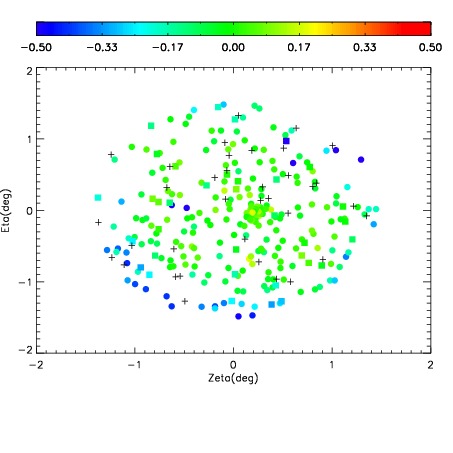
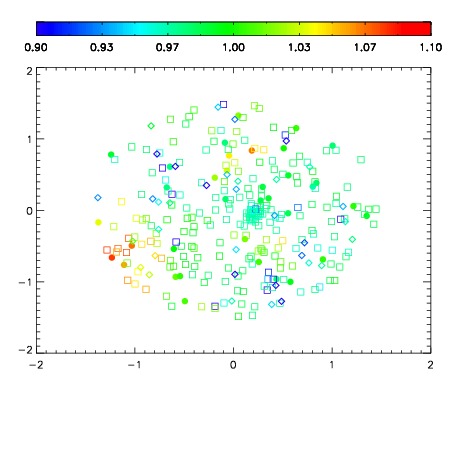
| Spatial mag deviation
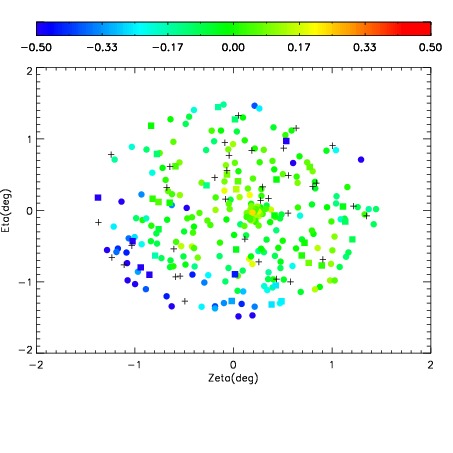
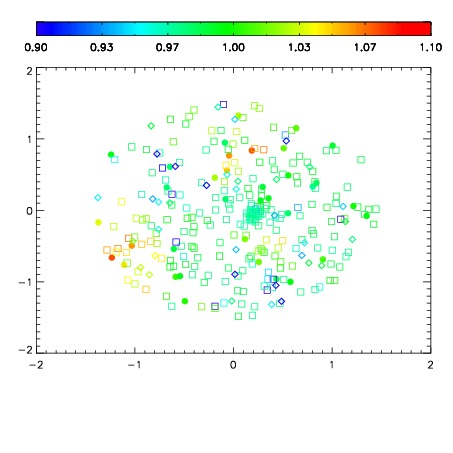
| Spatial sky 16325A emission deviations (filled: sky, open: star)
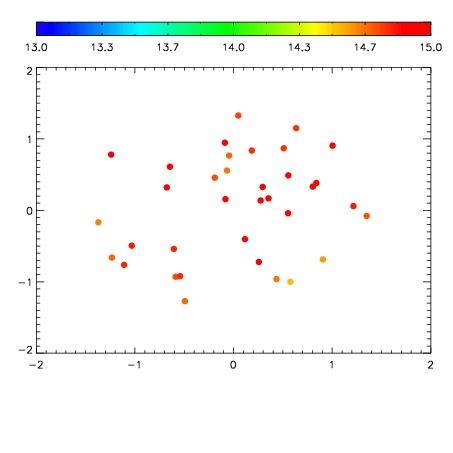
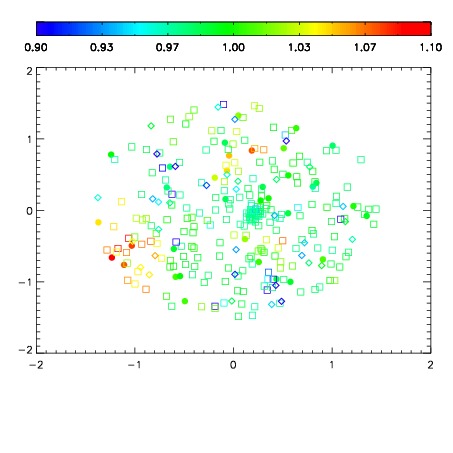
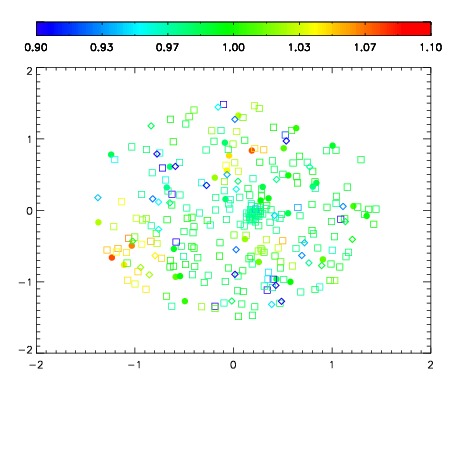
| Spatial sky continuum emission
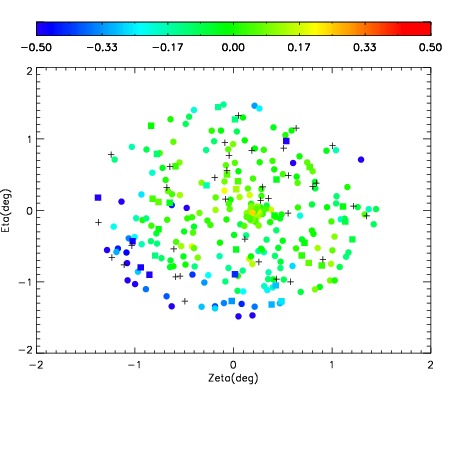
| Spatial sky telluric CO2 absorption deviations (filled: H < 10)
|
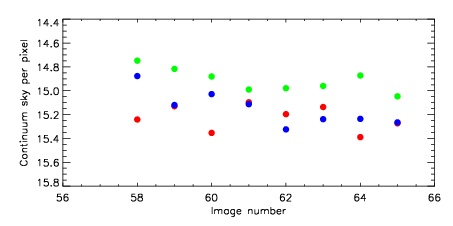
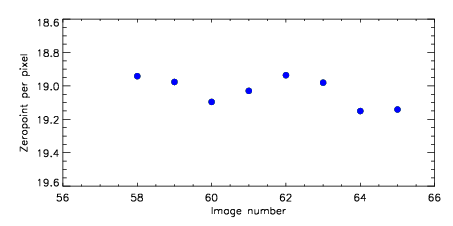
| 4360058
| 47
| | Red | Green | Blue
| | z | | 18.94
| | znorm | | 14.76
| | sky | 15.2 | 14.7 | 14.9
| | S/N | 16.4 | 26.9 | 28.1
| | S/N(c) | 14.6 | 25.7 | 26.8
| | SN(E/C) 0.41
|
| 
| 
| 
| 
| 
|
| 4360059
| 47
| | Red | Green | Blue
| | z | | 18.98
| | znorm | | 14.80
| | sky | 15.1 | 14.8 | 15.1
| | S/N | 16.7 | 27.5 | 29.1
| | S/N(c) | 15.1 | 26.3 | 27.9
| | SN(E/C) 0.40
|
| 
| 
| 
| 
| 
|
| 4360060
| 47
| | Red | Green | Blue
| | z | | 19.10
| | znorm | | 14.92
| | sky | 15.4 | 14.9 | 15.0
| | S/N | 18.2 | 29.4 | 31.2
| | S/N(c) | 16.3 | 28.1 | 29.8
| | SN(E/C) 0.38
|
| 
| 
| 
| 
| 
|
| 4360061
| 47
| | Red | Green | Blue
| | z | | 19.03
| | znorm | | 14.85
| | sky | 15.1 | 15.0 | 15.1
| | S/N | 17.3 | 28.4 | 30.2
| | S/N(c) | 15.5 | 27.1 | 28.8
| | SN(E/C) 0.39
|
| 
| 
| 
| 
| 
|
| 4360062
| 47
| | Red | Green | Blue
| | z | | 18.94
| | znorm | | 14.76
| | sky | 15.2 | 15.0 | 15.3
| | S/N | 16.3 | 27.0 | 28.5
| | S/N(c) | 14.6 | 25.7 | 27.2
| | SN(E/C) 0.41
|
| 
| 
| 
| 
| 
|
| 4360063
| 47
| | Red | Green | Blue
| | z | | 18.98
| | znorm | | 14.80
| | sky | 15.1 | 15.0 | 15.2
| | S/N | 16.5 | 27.4 | 28.8
| | S/N(c) | 14.7 | 25.9 | 27.4
| | SN(E/C) 0.37
|
| 
| 
| 
| 
| 
|
| 4360064
| 47
| | Red | Green | Blue
| | z | | 19.15
| | znorm | | 14.97
| | sky | 15.4 | 14.9 | 15.2
| | S/N | 18.0 | 29.6 | 31.2
| | S/N(c) | 16.3 | 28.4 | 30.0
| | SN(E/C) 0.37
|
| 
| 
| 
| 
| 
|
| 4360065
| 47
| | Red | Green | Blue
| | z | | 19.14
| | znorm | | 14.96
| | sky | 15.3 | 15.0 | 15.3
| | S/N | 18.1 | 29.5 | 31.2
| | S/N(c) | 16.4 | 28.1 | 29.9
| | SN(E/C) 0.37
|
| 
| 
| 
| 
| 
|