| Red | Green | Blue | |
| z | 17.65 | ||
| znorm | Inf | ||
| sky | -Inf | -Inf | -Inf |
| S/N | 31.0 | 53.9 | 57.0 |
| S/N(c) | 0.0 | 0.0 | 0.0 |
| SN(E/C) |
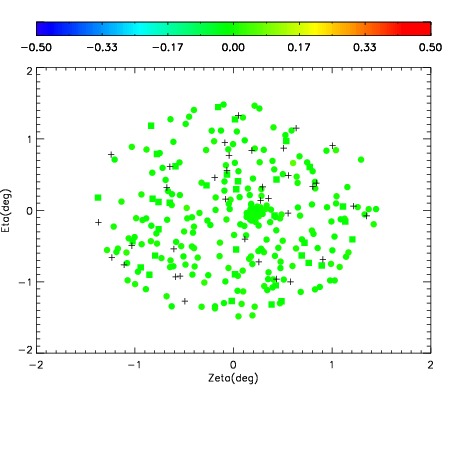
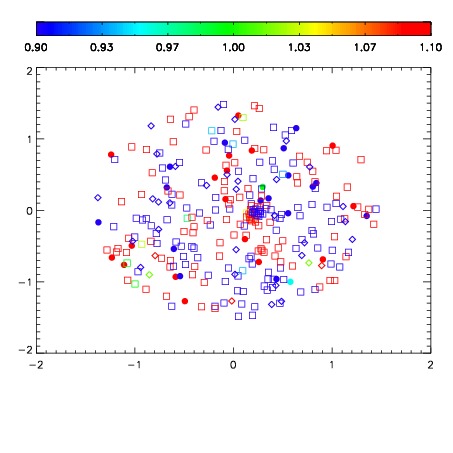
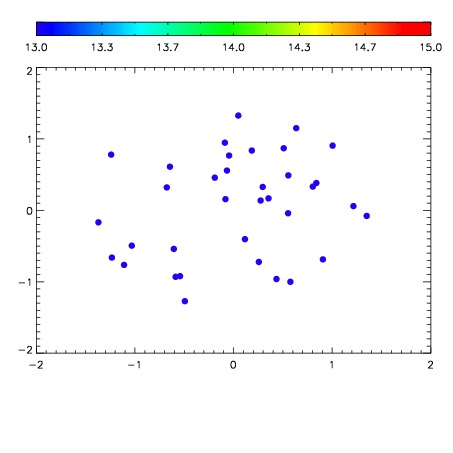

| Frame | Nreads | Zeropoints | Mag plots | Spatial mag deviation | Spatial sky 16325A emission deviations (filled: sky, open: star) | Spatial sky continuum emission | Spatial sky telluric CO2 absorption deviations (filled: H < 10) | |||||||||||||||||||||||
| 0 | 0 |
|
|
|
|
|
|
| IPAIR | NAME | SHIFT | NEWSHIFT | S/N | NAME | SHIFT | NEWSHIFT | S/N |
| 0 | 04360060 | 0.490930 | 0.00000 | 194.631 | 04360061 | -0.00148753 | 0.492418 | 189.774 |
| 1 | 04360064 | 0.490502 | 0.000427991 | 202.264 | 04360065 | -0.00221310 | 0.493143 | 200.941 |
| 2 | 04360063 | 0.490231 | 0.000698984 | 188.925 | 04360058 | 0.00000 | 0.490930 | 182.680 |
| 3 | 04360059 | 0.489663 | 0.00126699 | 185.134 | 04360062 | -0.00214448 | 0.493074 | 182.102 |