| Red | Green | Blue | |
| z | 17.64 | ||
| znorm | Inf | ||
| sky | -Inf | -Inf | -Inf |
| S/N | 23.7 | 43.3 | 45.3 |
| S/N(c) | 0.0 | 0.0 | 0.0 |
| SN(E/C) |

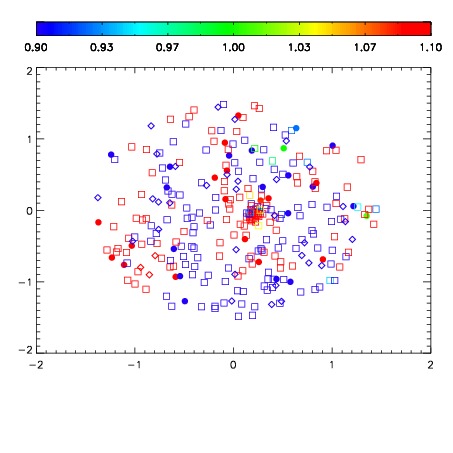
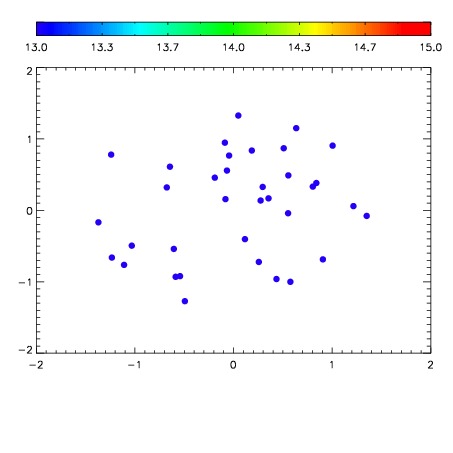

| Frame | Nreads | Zeropoints | Mag plots | Spatial mag deviation | Spatial sky 16325A emission deviations (filled: sky, open: star) | Spatial sky continuum emission | Spatial sky telluric CO2 absorption deviations (filled: H < 10) | |||||||||||||||||||||||
| 0 | 0 |
|
|
|
|
|
|
| IPAIR | NAME | SHIFT | NEWSHIFT | S/N | NAME | SHIFT | NEWSHIFT | S/N |
| 0 | 04630029 | 0.497577 | 0.00000 | 156.727 | 04630027 | -0.00180144 | 0.499378 | 166.441 |
| 1 | 04630028 | 0.496388 | 0.00118902 | 164.161 | 04630026 | 0.000122388 | 0.497455 | 166.901 |
| 2 | 04630025 | 0.497065 | 0.000512004 | 155.425 | 04630030 | -0.00211255 | 0.499690 | 157.551 |
| 3 | 04630024 | 0.496570 | 0.00100702 | 150.143 | 04630023 | 0.00000 | 0.497577 | 156.062 |