| Red | Green | Blue | |
| z | 17.64 | ||
| znorm | Inf | ||
| sky | -Inf | -Inf | -Inf |
| S/N | 27.3 | 47.0 | 50.4 |
| S/N(c) | 0.0 | 0.0 | 0.0 |
| SN(E/C) |
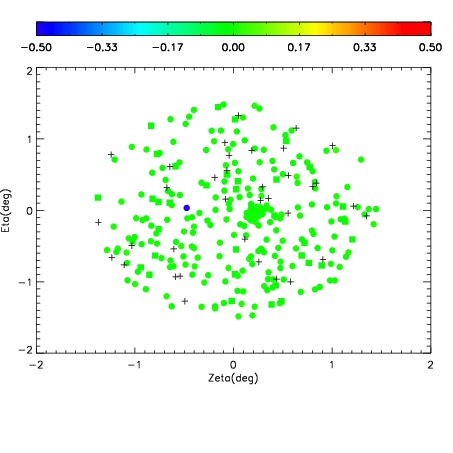
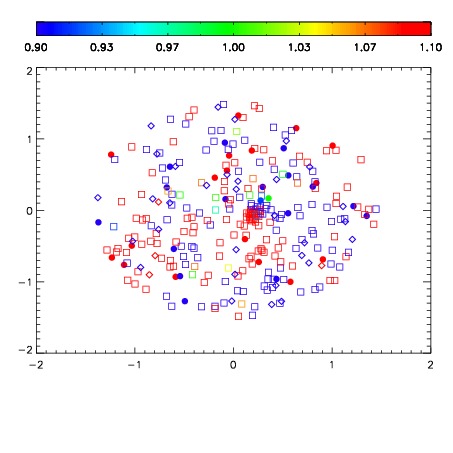
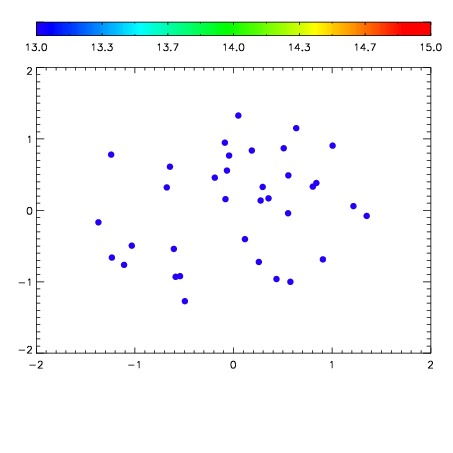

| Frame | Nreads | Zeropoints | Mag plots | Spatial mag deviation | Spatial sky 16325A emission deviations (filled: sky, open: star) | Spatial sky continuum emission | Spatial sky telluric CO2 absorption deviations (filled: H < 10) | |||||||||||||||||||||||
| 0 | 0 |
|
|
|
|
|
|
| IPAIR | NAME | SHIFT | NEWSHIFT | S/N | NAME | SHIFT | NEWSHIFT | S/N |
| 0 | 04860061 | 0.498166 | 0.00000 | 201.205 | 04860064 | -0.000811320 | 0.498977 | 199.131 |
| 1 | 04860062 | 0.497321 | 0.000844985 | 204.095 | 04860060 | 0.00000 | 0.498166 | 200.940 |
| 2 | 04860065 | 0.497604 | 0.000561982 | 202.553 | 04860063 | -7.12736e-05 | 0.498237 | 199.903 |