| Red | Green | Blue | |
| z | 17.64 | ||
| znorm | Inf | ||
| sky | -Inf | -Inf | -Inf |
| S/N | 31.5 | 54.2 | 58.6 |
| S/N(c) | 0.0 | 0.0 | 0.0 |
| SN(E/C) |
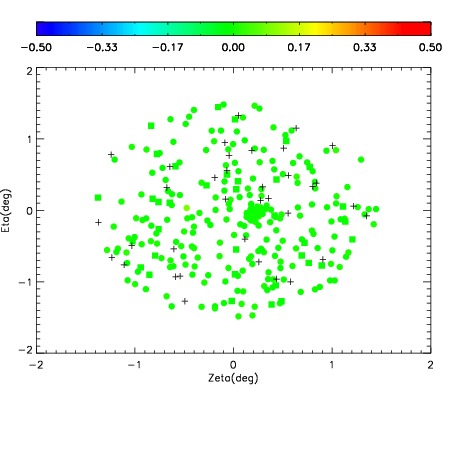
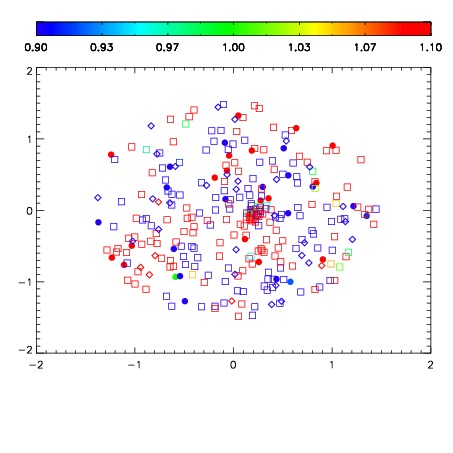
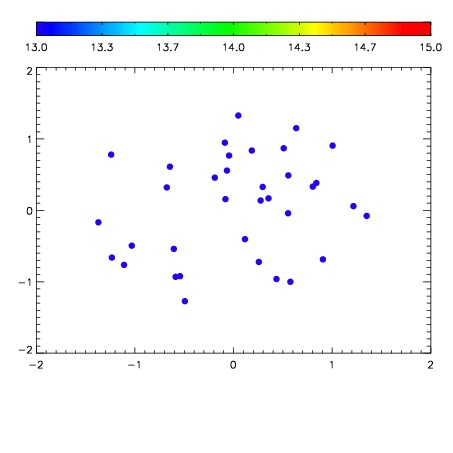

| Frame | Nreads | Zeropoints | Mag plots | Spatial mag deviation | Spatial sky 16325A emission deviations (filled: sky, open: star) | Spatial sky continuum emission | Spatial sky telluric CO2 absorption deviations (filled: H < 10) | |||||||||||||||||||||||
| 0 | 0 |
|
|
|
|
|
|
| IPAIR | NAME | SHIFT | NEWSHIFT | S/N | NAME | SHIFT | NEWSHIFT | S/N |
| 0 | 04870061 | 0.499012 | 0.00000 | 211.284 | 04870062 | 2.86395e-06 | 0.499009 | 207.862 |
| 1 | 04870060 | 0.498656 | 0.000355989 | 208.708 | 04870063 | 0.000970593 | 0.498041 | 207.713 |
| 2 | 04870064 | 0.497328 | 0.00168398 | 202.731 | 04870059 | 0.00000 | 0.499012 | 204.390 |
| 3 | 04870065 | 0.498608 | 0.000404000 | 194.920 | 04870066 | 0.000611727 | 0.498400 | 201.378 |