| Red | Green | Blue | |
| z | 17.64 | ||
| znorm | Inf | ||
| sky | -Inf | -Inf | -Inf |
| S/N | 21.5 | 38.7 | 42.8 |
| S/N(c) | 0.0 | 0.0 | 0.0 |
| SN(E/C) |
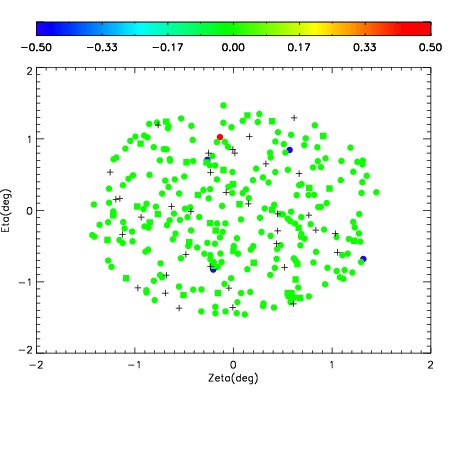
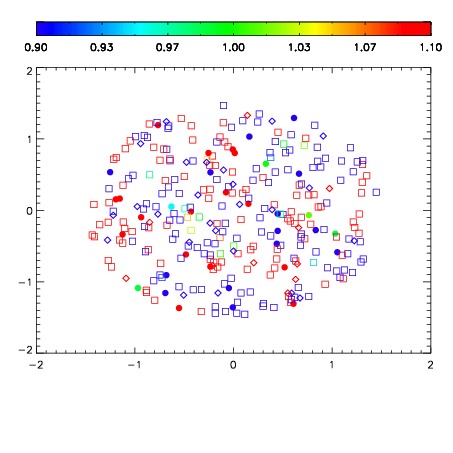
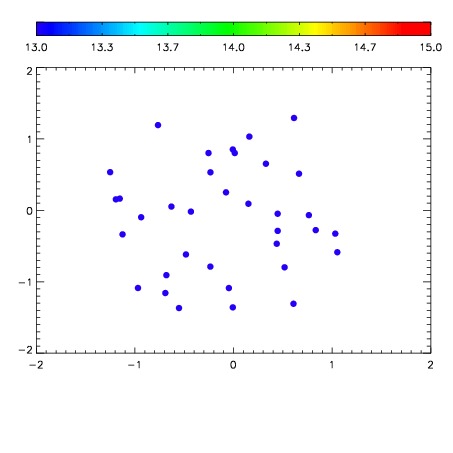

| Frame | Nreads | Zeropoints | Mag plots | Spatial mag deviation | Spatial sky 16325A emission deviations (filled: sky, open: star) | Spatial sky continuum emission | Spatial sky telluric CO2 absorption deviations (filled: H < 10) | |||||||||||||||||||||||
| 0 | 0 |
|
|
|
|
|
|
| IPAIR | NAME | SHIFT | NEWSHIFT | S/N | NAME | SHIFT | NEWSHIFT | S/N |
| 0 | 08770023 | 0.479834 | 0.00000 | 168.873 | 08770024 | 0.00214475 | 0.477689 | 188.525 |
| 1 | 08770027 | 0.478730 | 0.00110400 | 219.225 | 08770028 | 0.00228071 | 0.477553 | 210.491 |
| 2 | 08770026 | 0.477948 | 0.00188598 | 213.550 | 08770025 | 0.00238482 | 0.477449 | 204.006 |
| 3 | 08770022 | 0.479727 | 0.000106990 | 179.587 | 08770021 | 0.00000 | 0.479834 | 196.283 |