| Red | Green | Blue | |
| z | 17.64 | ||
| znorm | Inf | ||
| sky | -Inf | -Inf | -Inf |
| S/N | 25.5 | 44.8 | 47.3 |
| S/N(c) | 0.0 | 0.0 | 0.0 |
| SN(E/C) |
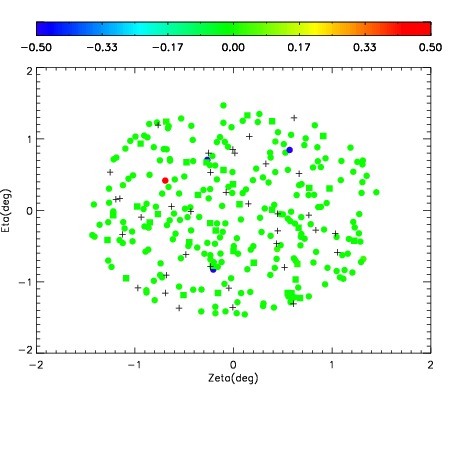
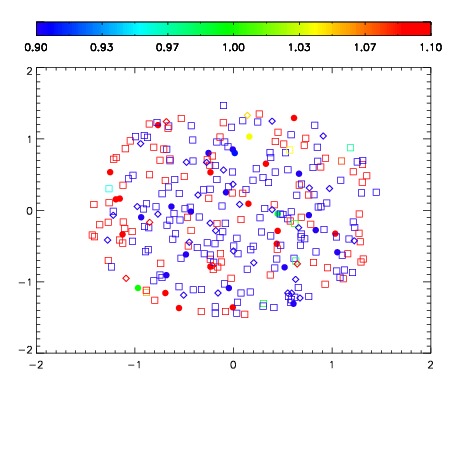
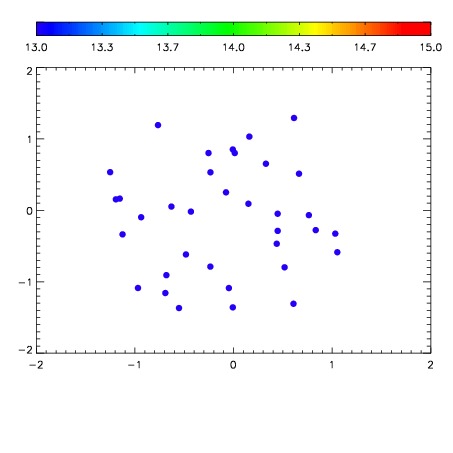

| Frame | Nreads | Zeropoints | Mag plots | Spatial mag deviation | Spatial sky 16325A emission deviations (filled: sky, open: star) | Spatial sky continuum emission | Spatial sky telluric CO2 absorption deviations (filled: H < 10) | |||||||||||||||||||||||
| 0 | 0 |
|
|
|
|
|
|
| IPAIR | NAME | SHIFT | NEWSHIFT | S/N | NAME | SHIFT | NEWSHIFT | S/N |
| 0 | 08990017 | 0.480997 | 0.00000 | 234.508 | 08990015 | -0.00245380 | 0.483451 | 231.197 |
| 1 | 08990013 | 0.478857 | 0.00213999 | 239.731 | 08990018 | -0.000697196 | 0.481694 | 239.403 |
| 2 | 08990016 | 0.480264 | 0.000732988 | 237.677 | 08990011 | 0.00000 | 0.480997 | 234.886 |
| 3 | 08990012 | 0.478351 | 0.00264600 | 236.289 | 08990014 | -0.00282218 | 0.483819 | 231.673 |