| Red | Green | Blue | |
| z | 17.64 | ||
| znorm | Inf | ||
| sky | -Inf | -Inf | -Inf |
| S/N | 22.5 | 41.4 | 44.2 |
| S/N(c) | 0.0 | 0.0 | 0.0 |
| SN(E/C) |
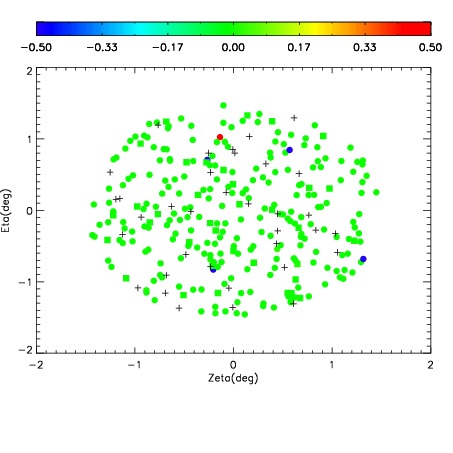
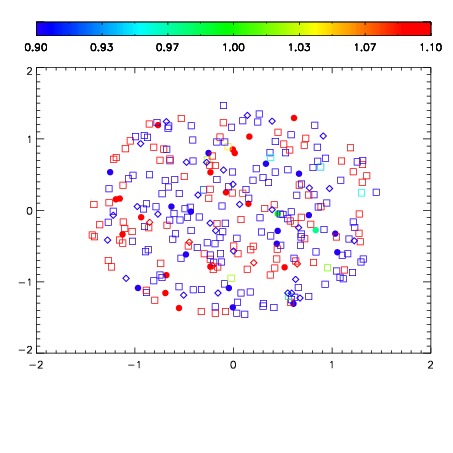
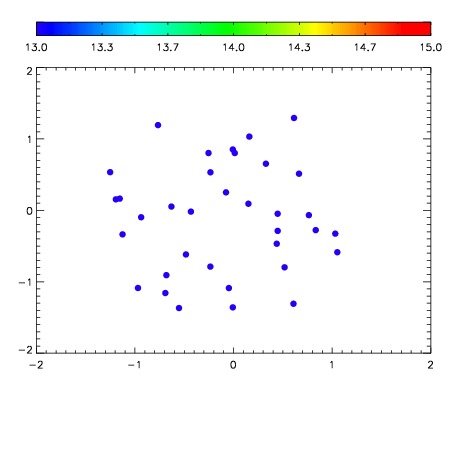

| Frame | Nreads | Zeropoints | Mag plots | Spatial mag deviation | Spatial sky 16325A emission deviations (filled: sky, open: star) | Spatial sky continuum emission | Spatial sky telluric CO2 absorption deviations (filled: H < 10) | |||||||||||||||||||||||
| 0 | 0 |
|
|
|
|
|
|
| IPAIR | NAME | SHIFT | NEWSHIFT | S/N | NAME | SHIFT | NEWSHIFT | S/N |
| 0 | 09060016 | 0.480803 | 0.00000 | 175.579 | 09060014 | 0.00206360 | 0.478739 | 174.608 |
| 1 | 09060017 | 0.480268 | 0.000535011 | 200.831 | 09060018 | 0.00381287 | 0.476990 | 199.600 |
| 2 | 09060013 | 0.477027 | 0.00377601 | 192.639 | 09060011 | 0.00000 | 0.480803 | 182.934 |
| 3 | 09060012 | 0.476458 | 0.00434500 | 192.361 | 09060015 | 0.00218526 | 0.478618 | 179.257 |