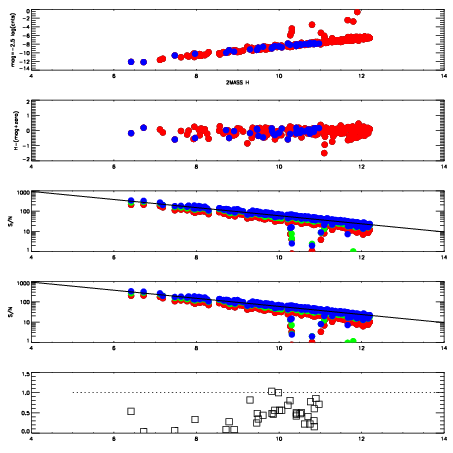
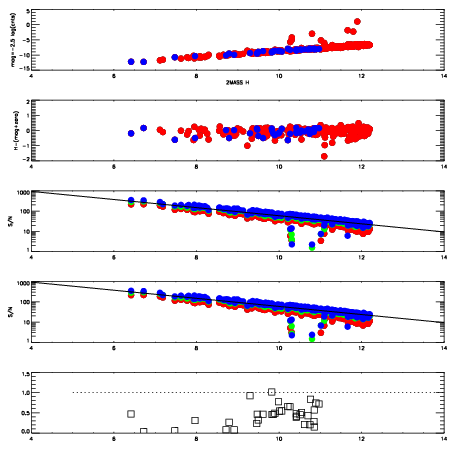
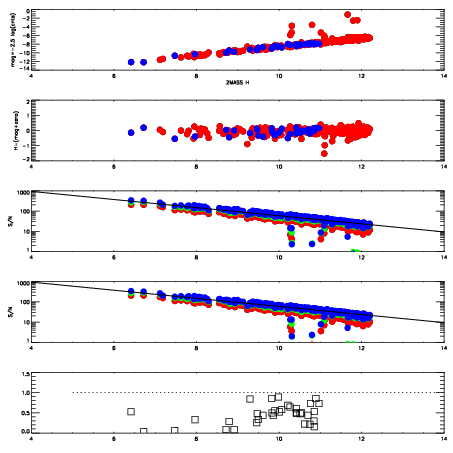
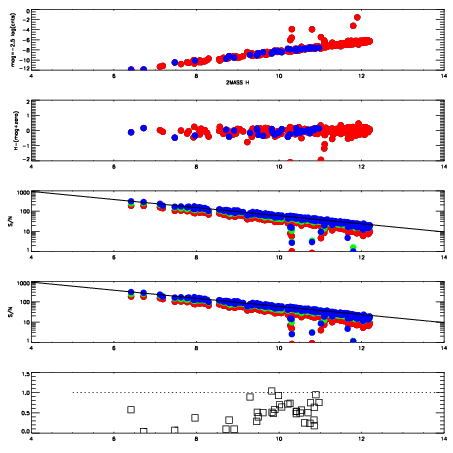
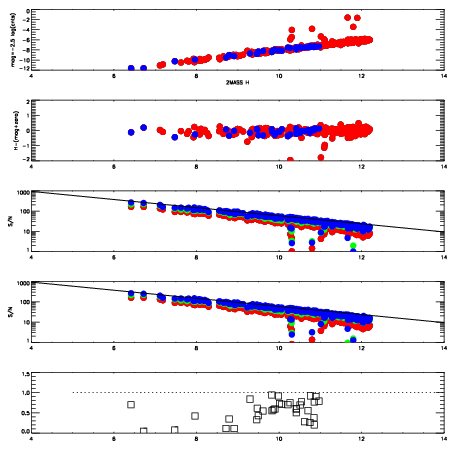
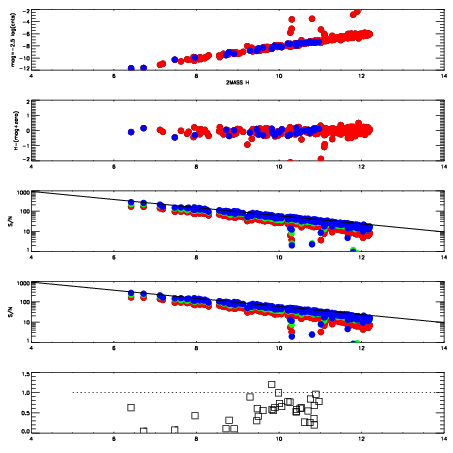
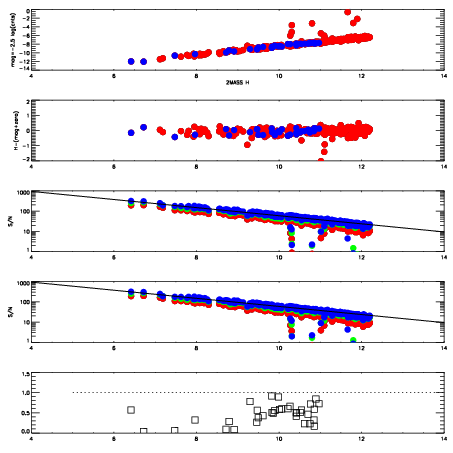
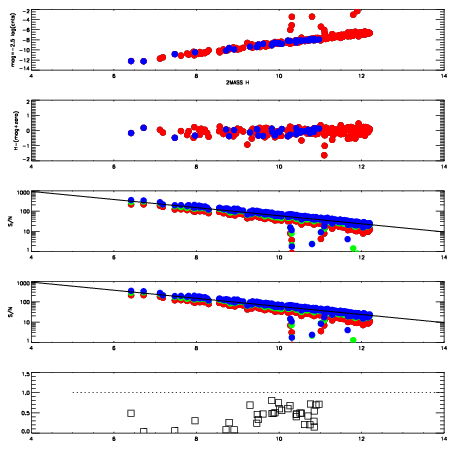
| Frame | Nreads | Zeropoints | Mag plots
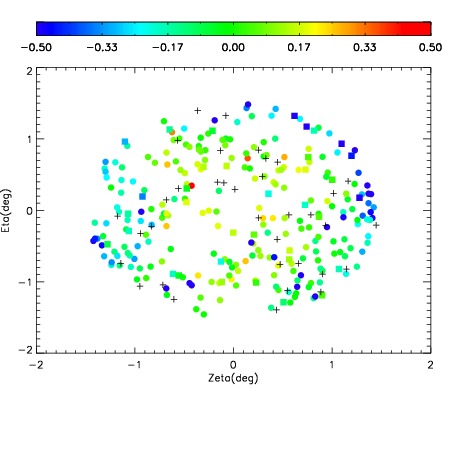
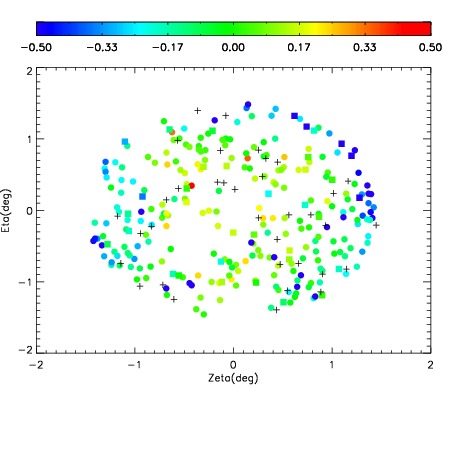
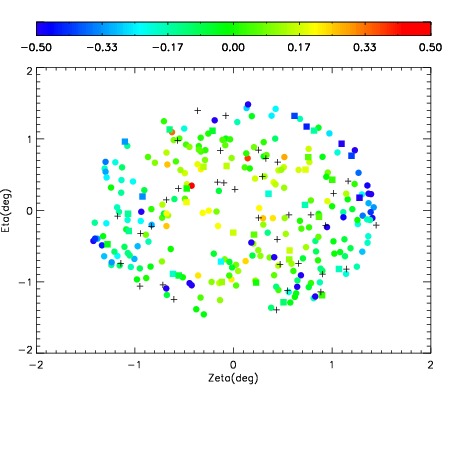
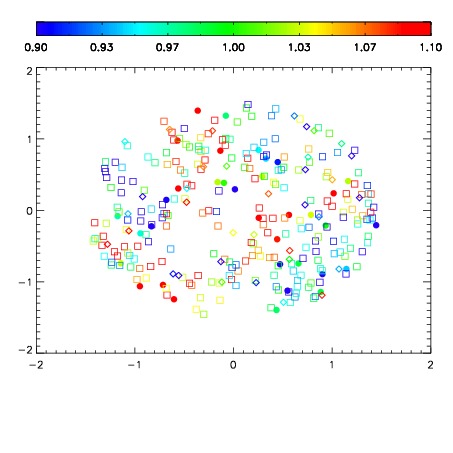
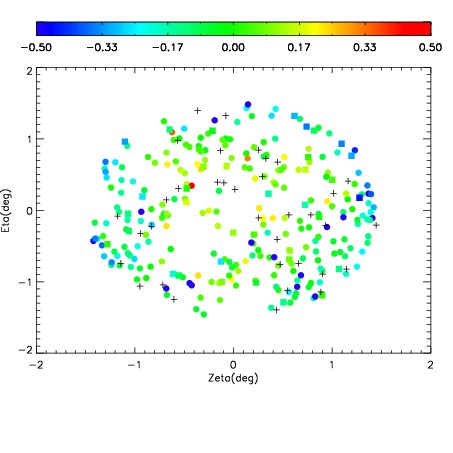
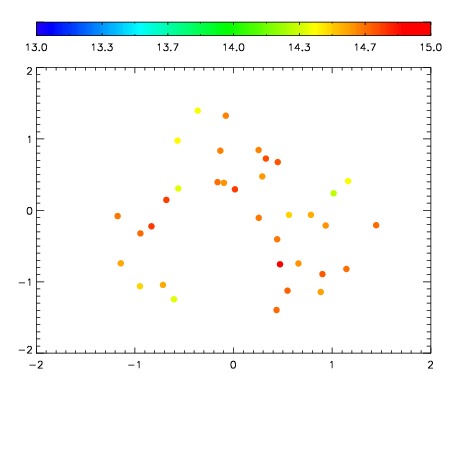
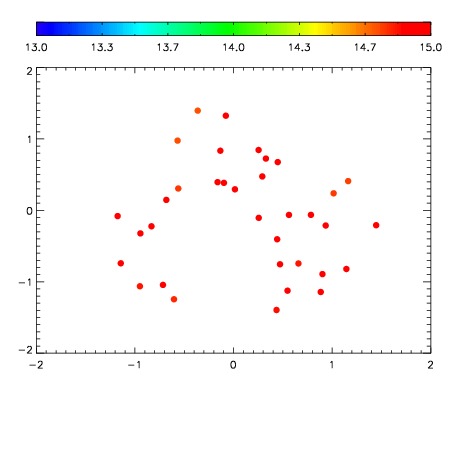
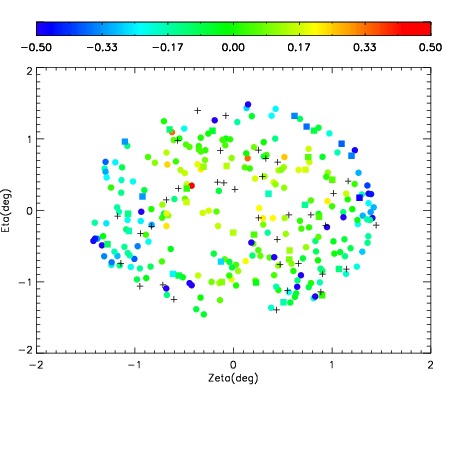
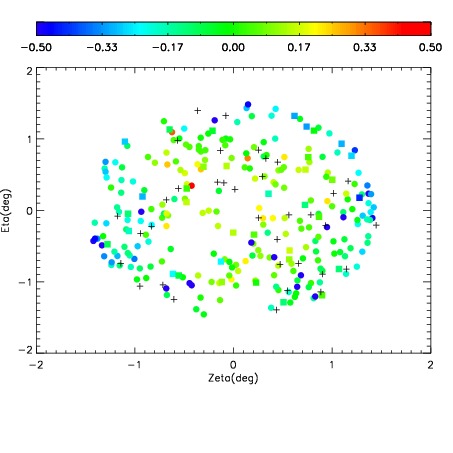
| Spatial mag deviation
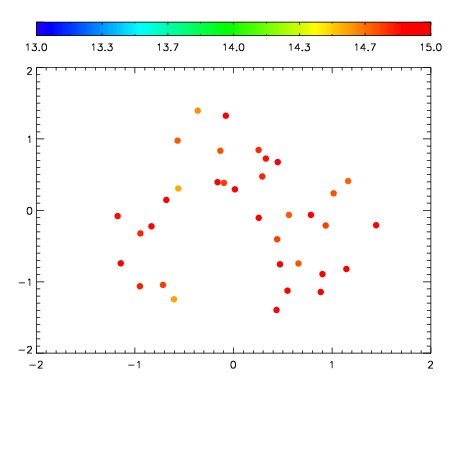
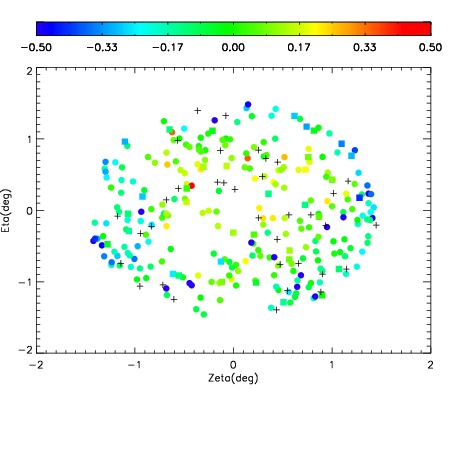
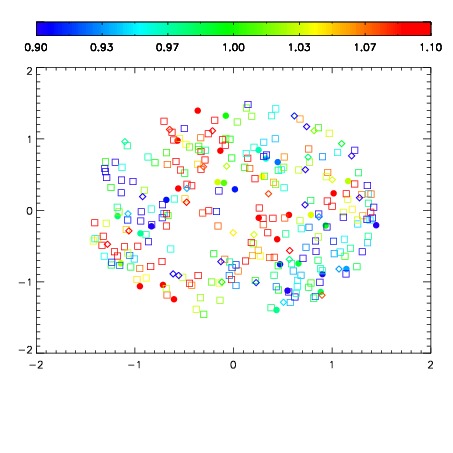
| Spatial sky 16325A emission deviations (filled: sky, open: star)
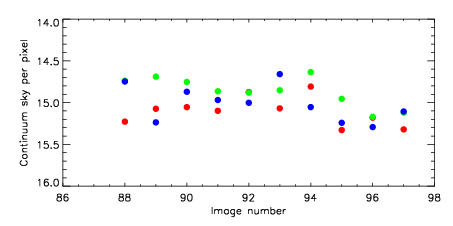
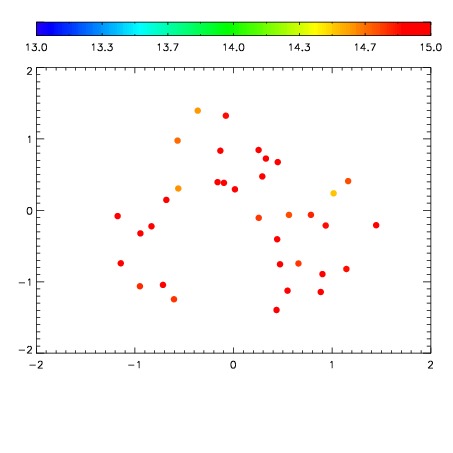
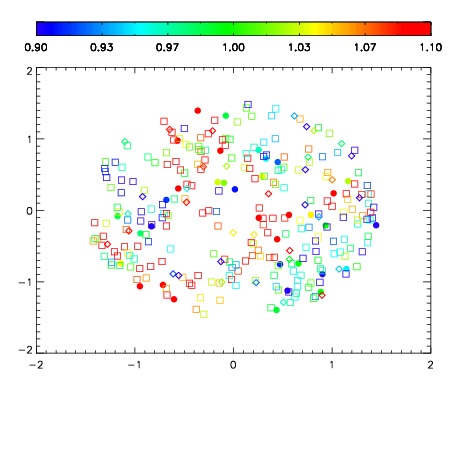
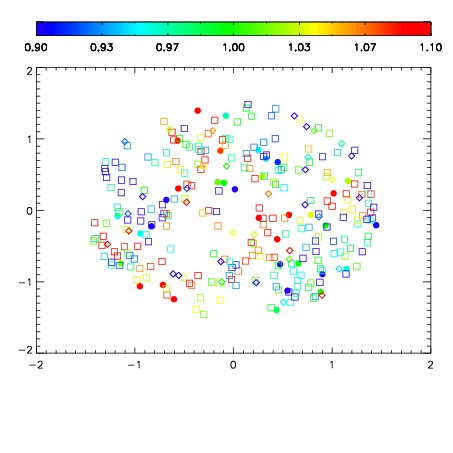
| Spatial sky continuum emission
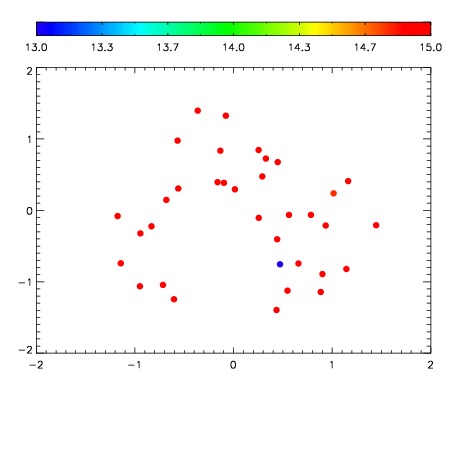
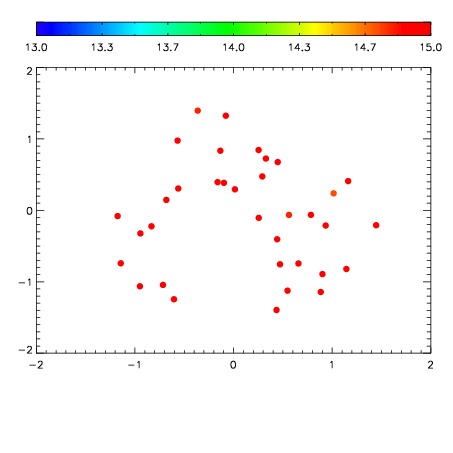
| Spatial sky telluric CO2 absorption deviations (filled: H < 10)
|
| 11390088
| 47
| | Red | Green | Blue
| | z | | 18.67
| | znorm | | 14.49
| | sky | 15.2 | 14.7 | 14.7
| | S/N | 11.6 | 19.5 | 22.0
| | S/N(c) | 10.1 | 18.4 | 20.6
| | SN(E/C) 0.47
|
| 
| 
| 
| 
| 
|
| 11390089
| 47
| | Red | Green | Blue
| | z | | 18.82
| | znorm | | 14.64
| | sky | 15.1 | 14.7 | 15.2
| | S/N | 12.5 | 21.3 | 23.8
| | S/N(c) | 11.0 | 20.0 | 22.7
| | SN(E/C) 0.46
|
| 
| 
| 
| 
| 
|
| 11390090
| 47
| | Red | Green | Blue
| | z | | 18.72
| | znorm | | 14.54
| | sky | 15.1 | 14.8 | 14.9
| | S/N | 11.7 | 20.5 | 22.7
| | S/N(c) | 10.4 | 19.3 | 21.1
| | SN(E/C) 0.46
|
| 
| 
| 
| 
| 
|
| 11390091
| 47
| | Red | Green | Blue
| | z | | 18.69
| | znorm | | 14.51
| | sky | 15.1 | 14.9 | 15.0
| | S/N | 11.5 | 20.1 | 22.3
| | S/N(c) | 10.2 | 18.7 | 21.2
| | SN(E/C) 0.48
|
| 
| 
| 
| 
| 
|
| 11390092
| 47
| | Red | Green | Blue
| | z | | 18.41
| | znorm | | 14.23
| | sky | 14.9 | 14.9 | 15.0
| | S/N | 9.5 | 17.2 | 19.2
| | S/N(c) | 8.3 | 15.9 | 17.7
| | SN(E/C) 0.51
|
| 
| 
| 
| 
| 
|
| 11390093
| 47
| | Red | Green | Blue
| | z | | 18.14
| | znorm | | 13.96
| | sky | 15.1 | 14.9 | 14.7
| | S/N | 7.8 | 14.5 | 16.0
| | S/N(c) | 6.7 | 13.4 | 14.9
| | SN(E/C) 0.59
|
| 
| 
| 
| 
| 
|
| 11390094
| 47
| | Red | Green | Blue
| | z | | 18.19
| | znorm | | 14.01
| | sky | 14.8 | 14.6 | 15.1
| | S/N | 7.8 | 15.1 | 16.7
| | S/N(c) | 6.8 | 13.9 | 15.3
| | SN(E/C) 0.58
|
| 
| 
| 
| 
| 
|
| 11390095
| 47
| | Red | Green | Blue
| | z | | 18.54
| | znorm | | 14.36
| | sky | 15.3 | 15.0 | 15.2
| | S/N | 10.4 | 18.8 | 20.3
| | S/N(c) | 9.2 | 17.7 | 19.1
| | SN(E/C) 0.51
|
| 
| 
| 
| 
| 
|
| 11390096
| 47
| | Red | Green | Blue
| | z | | 18.78
| | znorm | | 14.60
| | sky | 15.2 | 15.2 | 15.3
| | S/N | 12.2 | 21.5 | 22.9
| | S/N(c) | 10.9 | 20.1 | 21.7
| | SN(E/C) 0.47
|
| 
| 
| 
| 
| 
|
| 11390097
| 47
| | Red | Green | Blue
| | z | | 18.68
| | znorm | | 14.50
| | sky | 15.3 | 15.1 | 15.1
| | S/N | 11.5 | 20.4 | 21.6
| | S/N(c) | 10.1 | 18.7 | 20.5
| | SN(E/C) 0.48
|
| 
| 
| 
| 
| 
|