| Red | Green | Blue | |
| z | 17.64 | ||
| znorm | Inf | ||
| sky | -Inf | -Inf | -Inf |
| S/N | 20.8 | 39.8 | 43.8 |
| S/N(c) | 0.0 | 0.0 | 0.0 |
| SN(E/C) |
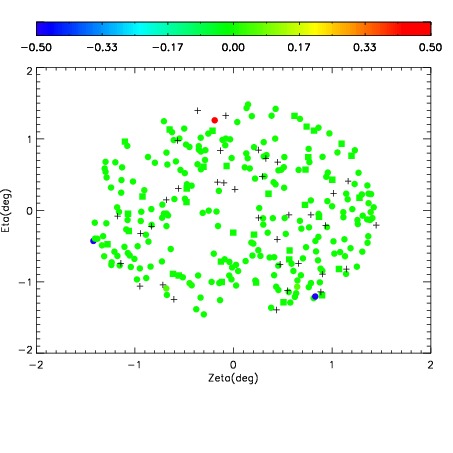
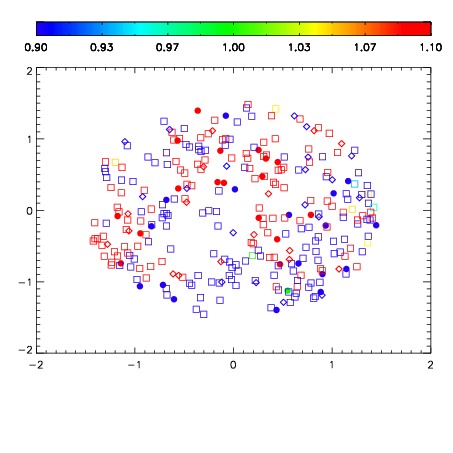
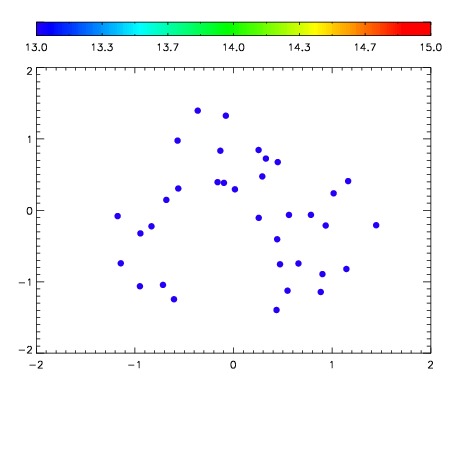

| Frame | Nreads | Zeropoints | Mag plots | Spatial mag deviation | Spatial sky 16325A emission deviations (filled: sky, open: star) | Spatial sky continuum emission | Spatial sky telluric CO2 absorption deviations (filled: H < 10) | |||||||||||||||||||||||
| 0 | 0 |
|
|
|
|
|
|
| IPAIR | NAME | SHIFT | NEWSHIFT | S/N | NAME | SHIFT | NEWSHIFT | S/N |
| 0 | 11390097 | 0.472231 | 0.00000 | 149.422 | 11390088 | 0.00000 | 0.472231 | 150.302 |
| 1 | 11390089 | 0.469770 | 0.00246099 | 162.122 | 11390096 | -0.00273512 | 0.474966 | 157.397 |
| 2 | 11390090 | 0.470183 | 0.00204799 | 155.695 | 11390091 | -0.00417415 | 0.476405 | 153.085 |
| 3 | 11390094 | 0.470661 | 0.00156999 | 120.916 | 11390095 | -0.00375851 | 0.475990 | 141.085 |
| 4 | 11390093 | 0.469661 | 0.00257000 | 116.626 | 11390092 | -0.00410981 | 0.476341 | 134.854 |