| Frame | Nreads | Zeropoints | Mag plots
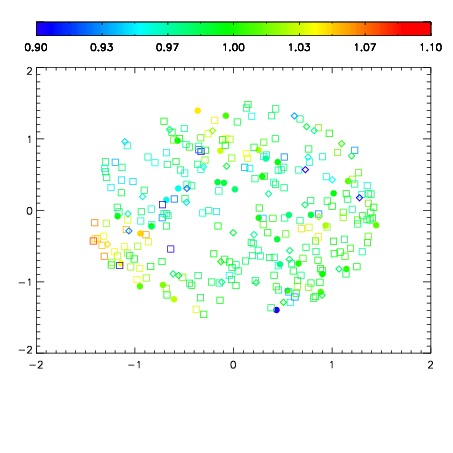
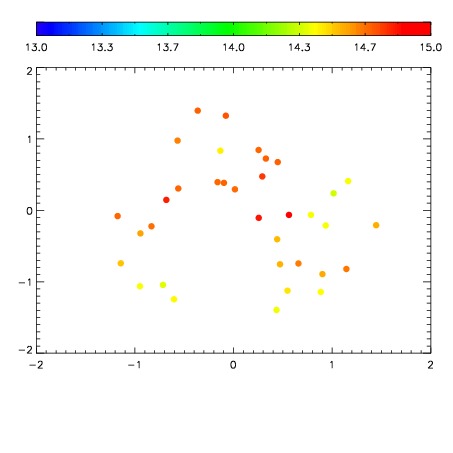
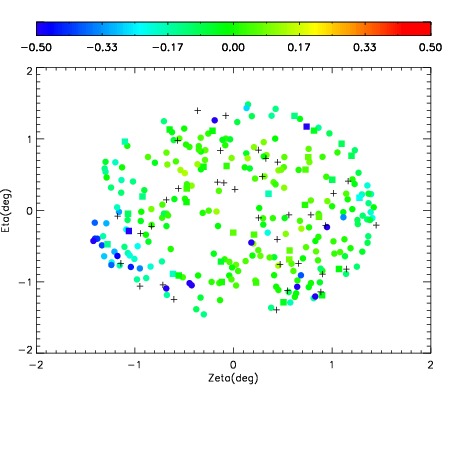
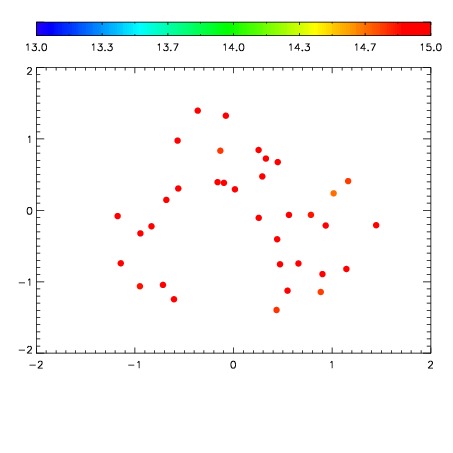
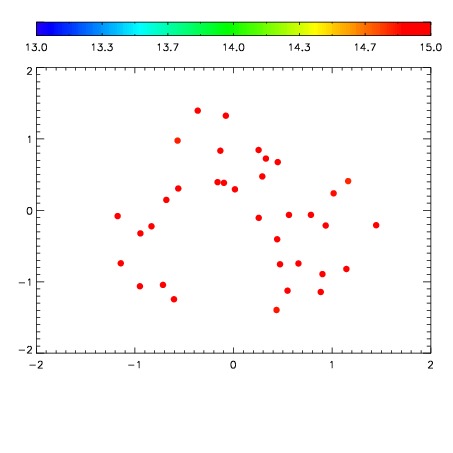
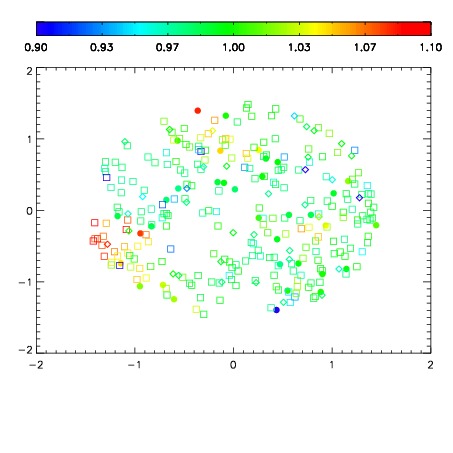
| Spatial mag deviation
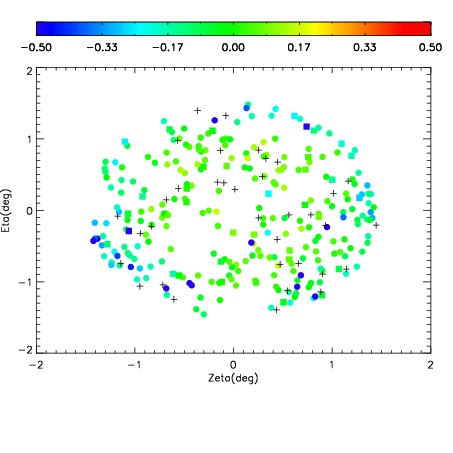
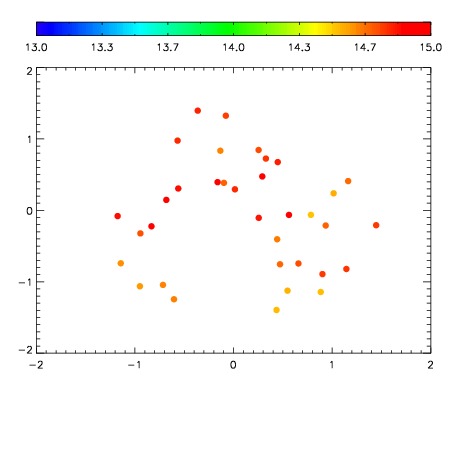
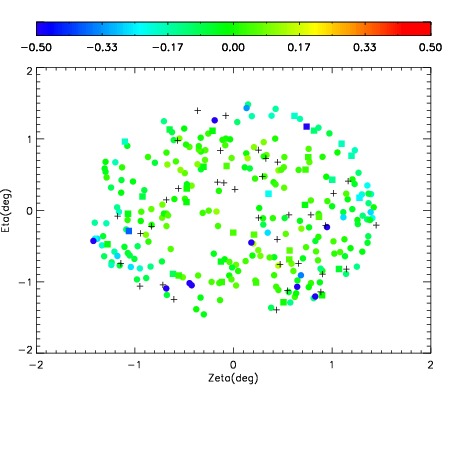
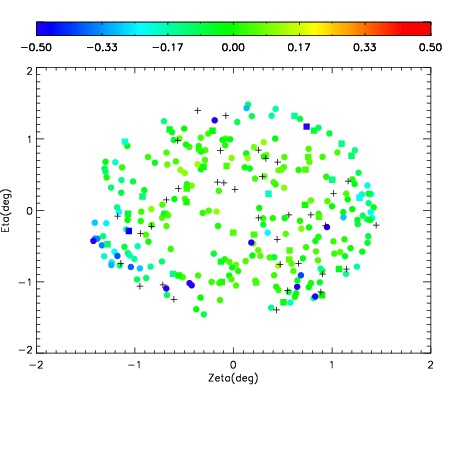
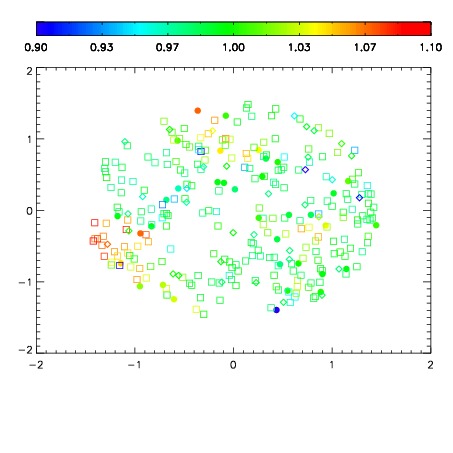
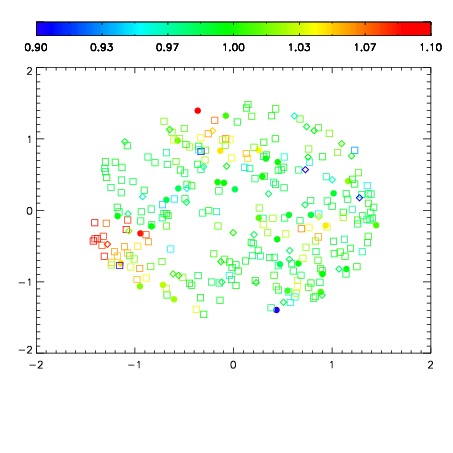
| Spatial sky 16325A emission deviations (filled: sky, open: star)
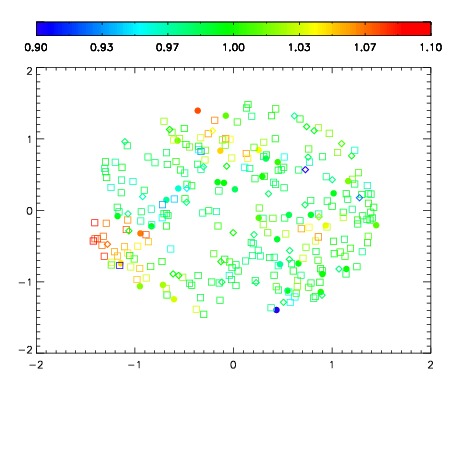
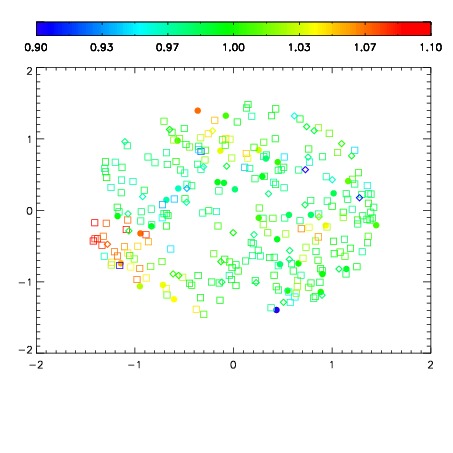
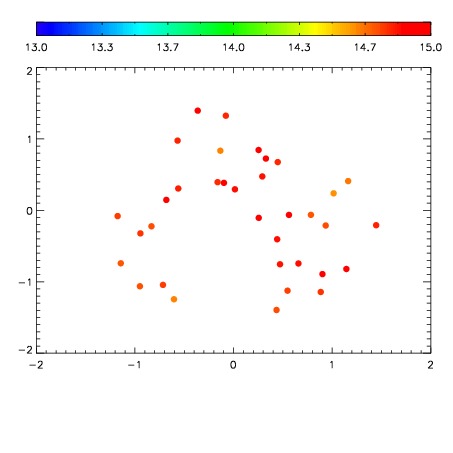
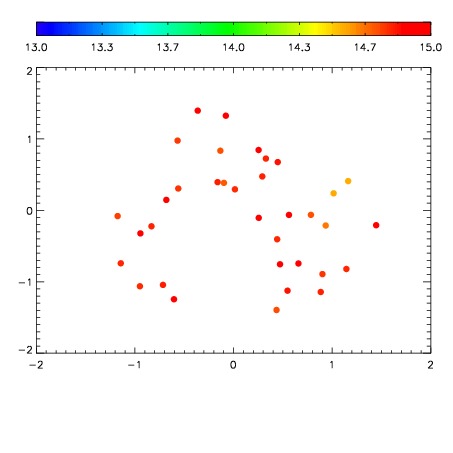
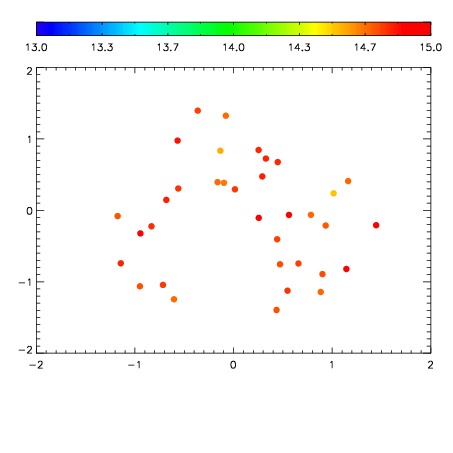
| Spatial sky continuum emission
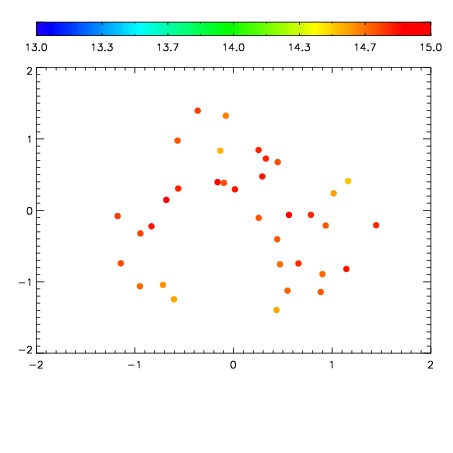
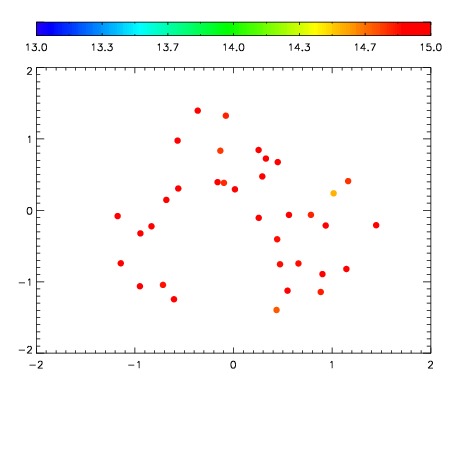
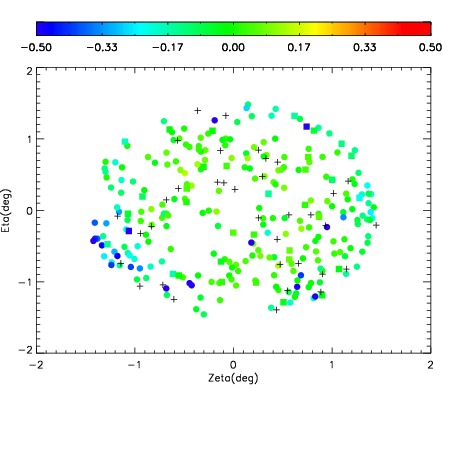
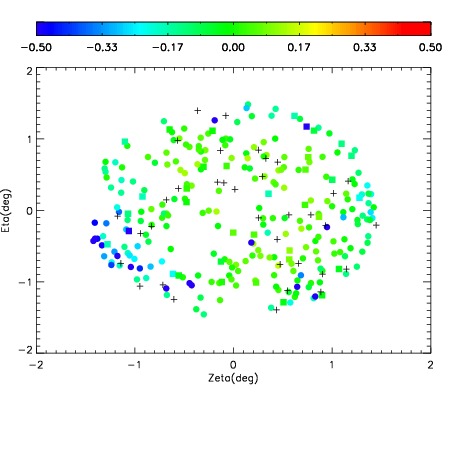
| Spatial sky telluric CO2 absorption deviations (filled: H < 10)
|
| 11430061
| 47
| | Red | Green | Blue
| | z | | 18.37
| | znorm | | 14.19
| | sky | 15.1 | 14.5 | 14.6
| | S/N | 9.4 | 16.6 | 18.3
| | S/N(c) | 8.0 | 15.4 | 16.9
| | SN(E/C) 0.55
|
| 
| 
| 
| 
| 
|
| 11430062
| 47
| | Red | Green | Blue
| | z | | 18.40
| | znorm | | 14.22
| | sky | 15.2 | 14.6 | 14.9
| | S/N | 9.5 | 17.1 | 19.0
| | S/N(c) | 8.1 | 15.9 | 17.3
| | SN(E/C) 0.53
|
| 
| 
| 
| 
| 
|
| 11430063
| 47
| | Red | Green | Blue
| | z | | 18.25
| | znorm | | 14.07
| | sky | 15.4 | 14.7 | 15.0
| | S/N | 8.6 | 15.5 | 17.7
| | S/N(c) | 7.1 | 14.5 | 16.3
| | SN(E/C) 0.56
|
| 
| 
| 
| 
| 
|
| 11430064
| 47
| | Red | Green | Blue
| | z | | 17.85
| | znorm | | 13.67
| | sky | 15.0 | 14.7 | 15.2
| | S/N | 6.2 | 12.1 | 13.8
| | S/N(c) | 5.2 | 11.2 | 12.6
| | SN(E/C) 0.65
|
| 
| 
| 
| 
| 
|
| 11430065
| 47
| | Red | Green | Blue
| | z | | 17.99
| | znorm | | 13.81
| | sky | 15.1 | 14.9 | 15.2
| | S/N | 6.9 | 13.5 | 15.0
| | S/N(c) | 5.8 | 12.3 | 13.7
| | SN(E/C) 0.63
|
| 
| 
| 
| 
| 
|
| 11430066
| 47
| | Red | Green | Blue
| | z | | 18.07
| | znorm | | 13.89
| | sky | 15.1 | 14.8 | 15.1
| | S/N | 7.3 | 13.8 | 15.5
| | S/N(c) | 6.1 | 12.9 | 14.3
| | SN(E/C) 0.59
|
| 
| 
| 
| 
| 
|
| 11430067
| 47
| | Red | Green | Blue
| | z | | 18.09
| | znorm | | 13.91
| | sky | 15.1 | 15.0 | 15.0
| | S/N | 7.3 | 14.0 | 15.6
| | S/N(c) | 6.2 | 12.8 | 14.5
| | SN(E/C) 0.58
|
| 
| 
| 
| 
| 
|
| 11430068
| 47
| | Red | Green | Blue
| | z | | 18.01
| | znorm | | 13.83
| | sky | 15.3 | 15.0 | 15.2
| | S/N | 7.0 | 13.5 | 14.9
| | S/N(c) | 6.0 | 12.4 | 13.6
| | SN(E/C) 0.61
|
| 
| 
| 
| 
| 
|
| 11430069
| 47
| | Red | Green | Blue
| | z | | 18.34
| | znorm | | 14.16
| | sky | 14.8 | 14.8 | 15.2
| | S/N | 9.0 | 16.4 | 17.3
| | S/N(c) | 7.7 | 15.2 | 16.2
| | SN(E/C) 0.57
|
| 
| 
| 
| 
| 
|
| 11430070
| 47
| | Red | Green | Blue
| | z | | 18.08
| | znorm | | 13.90
| | sky | 15.1 | 14.8 | 15.0
| | S/N | 7.5 | 14.1 | 15.1
| | S/N(c) | 6.4 | 13.0 | 14.1
| | SN(E/C) 0.59
|
| 
| 
| 
| 
| 
|