| Red | Green | Blue | |
| z | 17.64 | ||
| znorm | Inf | ||
| sky | -Inf | -Inf | -Inf |
| S/N | 14.9 | 30.1 | 33.8 |
| S/N(c) | 0.0 | 0.0 | 0.0 |
| SN(E/C) |
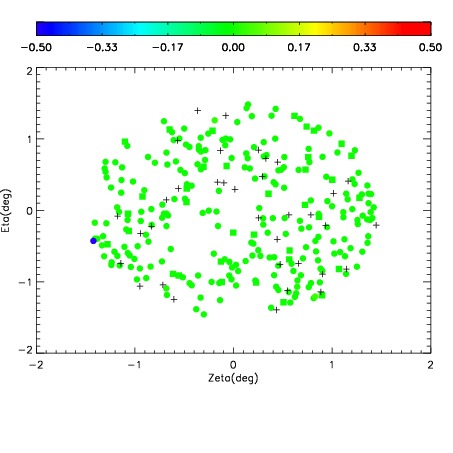
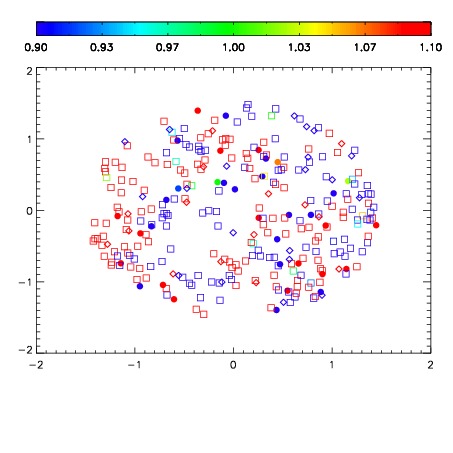
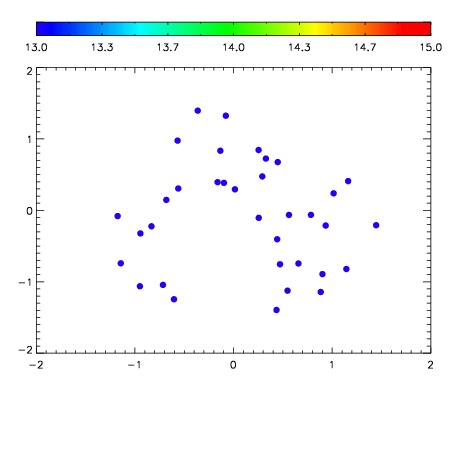

| Frame | Nreads | Zeropoints | Mag plots | Spatial mag deviation | Spatial sky 16325A emission deviations (filled: sky, open: star) | Spatial sky continuum emission | Spatial sky telluric CO2 absorption deviations (filled: H < 10) | |||||||||||||||||||||||
| 0 | 0 |
|
|
|
|
|
|
| IPAIR | NAME | SHIFT | NEWSHIFT | S/N | NAME | SHIFT | NEWSHIFT | S/N |
| 0 | 11430070 | 0.483079 | 0.00000 | 141.105 | 11430064 | -0.000310409 | 0.483389 | 131.426 |
| 1 | 11430062 | 0.481993 | 0.00108600 | 169.144 | 11430061 | 0.00000 | 0.483079 | 166.801 |
| 2 | 11430063 | 0.482653 | 0.000425994 | 157.788 | 11430069 | -0.00104735 | 0.484126 | 160.598 |
| 3 | 11430067 | 0.482782 | 0.000296980 | 144.150 | 11430065 | -0.000602292 | 0.483681 | 138.124 |
| 4 | 11430066 | 0.482710 | 0.000368983 | 142.058 | 11430068 | -0.000918534 | 0.483998 | 137.271 |