| Red | Green | Blue | |
| z | 17.64 | ||
| znorm | Inf | ||
| sky | -Inf | -NaN | -Inf |
| S/N | 25.7 | 43.9 | 49.4 |
| S/N(c) | 0.0 | 0.0 | 0.0 |
| SN(E/C) |
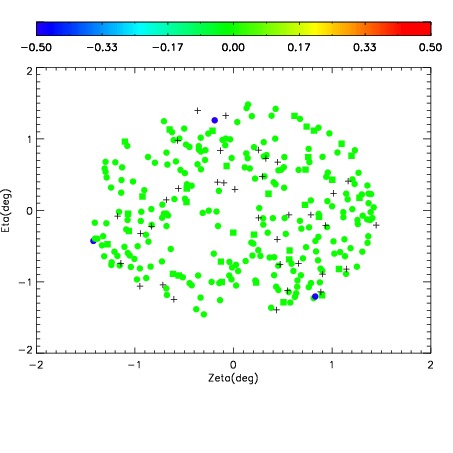
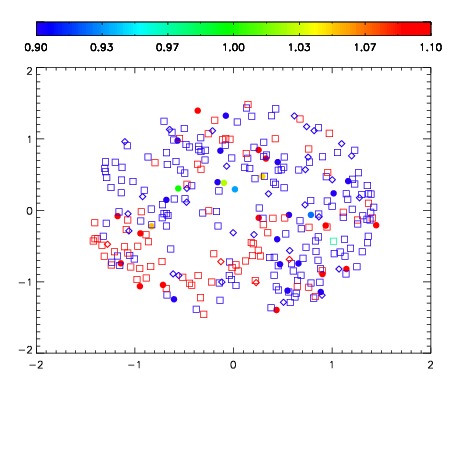
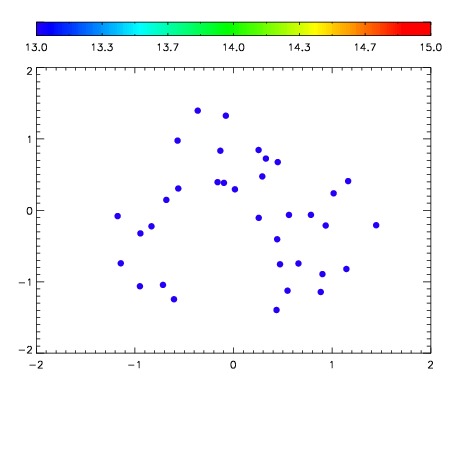

| Frame | Nreads | Zeropoints | Mag plots | Spatial mag deviation | Spatial sky 16325A emission deviations (filled: sky, open: star) | Spatial sky continuum emission | Spatial sky telluric CO2 absorption deviations (filled: H < 10) | |||||||||||||||||||||||
| 0 | 0 |
|
|
|
|
|
|
| IPAIR | NAME | SHIFT | NEWSHIFT | S/N | NAME | SHIFT | NEWSHIFT | S/N |
| 0 | 11710082 | 0.487132 | 0.00000 | 212.590 | 11710081 | 0.00000 | 0.487132 | 208.060 |
| 1 | 11710086 | 0.484964 | 0.00216800 | 214.802 | 11710084 | -0.000613572 | 0.487746 | 212.173 |
| 2 | 11710087 | 0.485845 | 0.00128701 | 213.144 | 11710085 | -0.000563342 | 0.487695 | 210.666 |
| 3 | 11710083 | 0.486497 | 0.000634998 | 211.361 | 11710088 | -0.00278032 | 0.489912 | 206.732 |