| Red | Green | Blue | |
| z | 17.64 | ||
| znorm | Inf | ||
| sky | -Inf | -Inf | -Inf |
| S/N | 21.7 | 40.1 | 44.2 |
| S/N(c) | 0.0 | 0.0 | 0.0 |
| SN(E/C) |
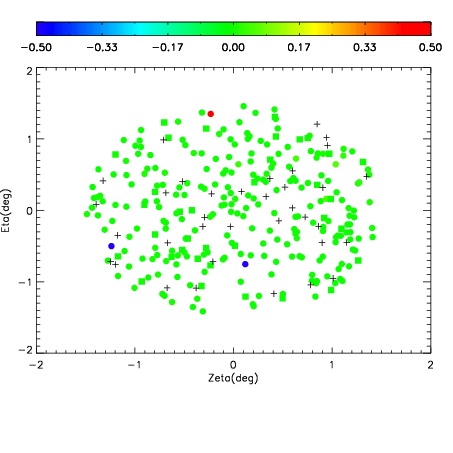
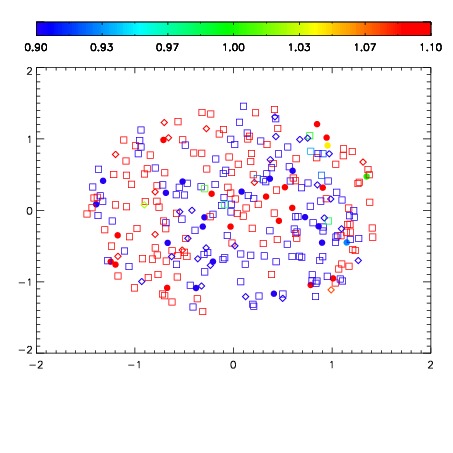
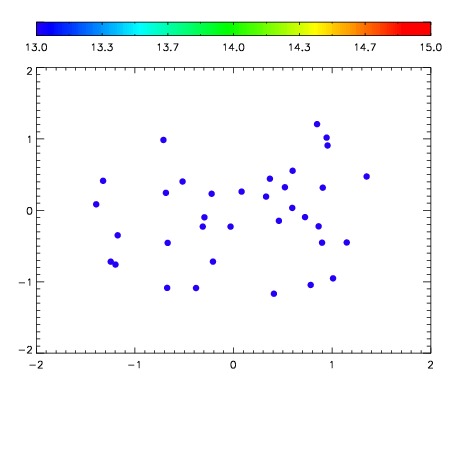

| Frame | Nreads | Zeropoints | Mag plots | Spatial mag deviation | Spatial sky 16325A emission deviations (filled: sky, open: star) | Spatial sky continuum emission | Spatial sky telluric CO2 absorption deviations (filled: H < 10) | |||||||||||||||||||||||
| 0 | 0 |
|
|
|
|
|
|
| IPAIR | NAME | SHIFT | NEWSHIFT | S/N | NAME | SHIFT | NEWSHIFT | S/N |
| 0 | 11400087 | 0.472821 | 0.00000 | 207.438 | 11400085 | 0.00000 | 0.472821 | 206.442 |
| 1 | 11400091 | 0.472253 | 0.000568002 | 219.068 | 11400092 | 0.00284186 | 0.469979 | 215.124 |
| 2 | 11400086 | 0.471357 | 0.00146401 | 208.130 | 11400088 | -0.00292610 | 0.475747 | 212.142 |
| 3 | 11400090 | 0.472050 | 0.000770986 | 205.557 | 11400089 | -0.00176668 | 0.474588 | 204.723 |