| Red | Green | Blue | |
| z | 17.64 | ||
| znorm | Inf | ||
| sky | -Inf | -Inf | -Inf |
| S/N | 25.0 | 44.1 | 47.5 |
| S/N(c) | 0.0 | 0.0 | 0.0 |
| SN(E/C) |
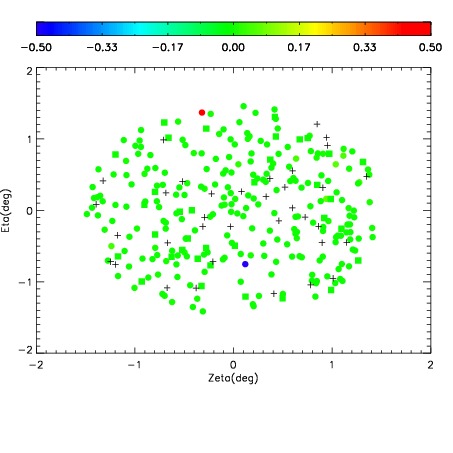
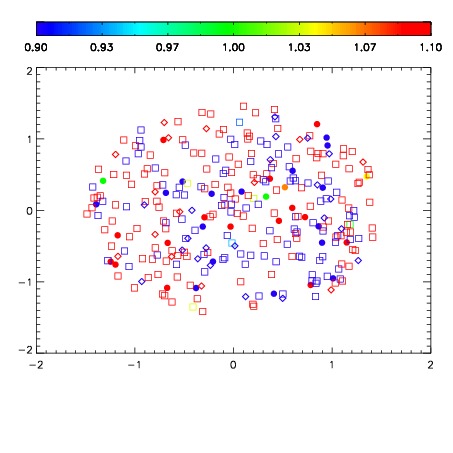
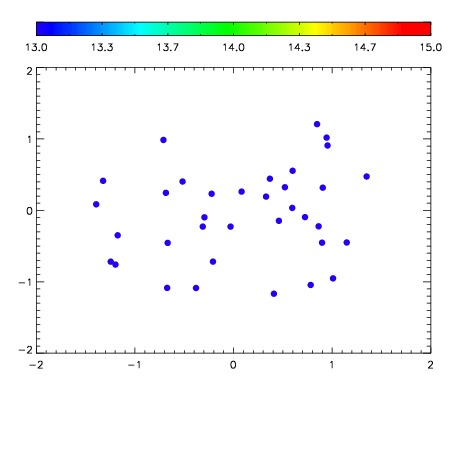

| Frame | Nreads | Zeropoints | Mag plots | Spatial mag deviation | Spatial sky 16325A emission deviations (filled: sky, open: star) | Spatial sky continuum emission | Spatial sky telluric CO2 absorption deviations (filled: H < 10) | |||||||||||||||||||||||
| 0 | 0 |
|
|
|
|
|
|
| IPAIR | NAME | SHIFT | NEWSHIFT | S/N | NAME | SHIFT | NEWSHIFT | S/N |
| 0 | 11440070 | 0.479316 | 0.00000 | 211.658 | 11440072 | -0.00217373 | 0.481490 | 208.769 |
| 1 | 11440073 | 0.472601 | 0.00671500 | 213.498 | 11440075 | -0.00426473 | 0.483581 | 212.714 |
| 2 | 11440074 | 0.473207 | 0.00610900 | 211.902 | 11440071 | -0.00197604 | 0.481292 | 209.357 |
| 3 | 11440069 | 0.478517 | 0.000799000 | 210.722 | 11440068 | 0.00000 | 0.479316 | 206.368 |