| Red | Green | Blue | |
| z | 17.64 | ||
| znorm | Inf | ||
| sky | -Inf | -Inf | -Inf |
| S/N | 26.3 | 46.5 | 50.4 |
| S/N(c) | 0.0 | 0.0 | 0.0 |
| SN(E/C) |
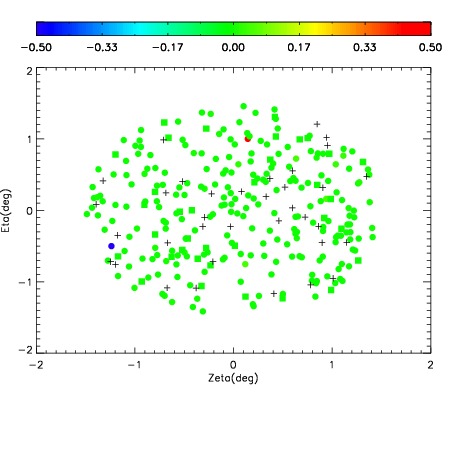
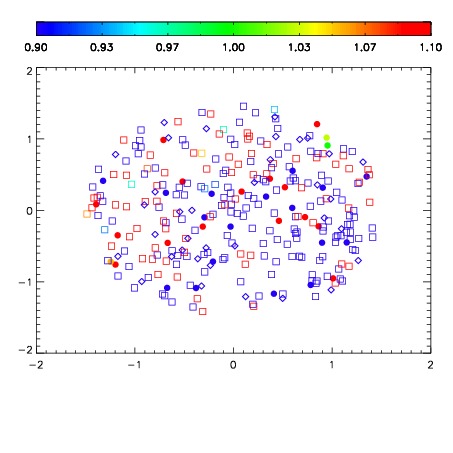
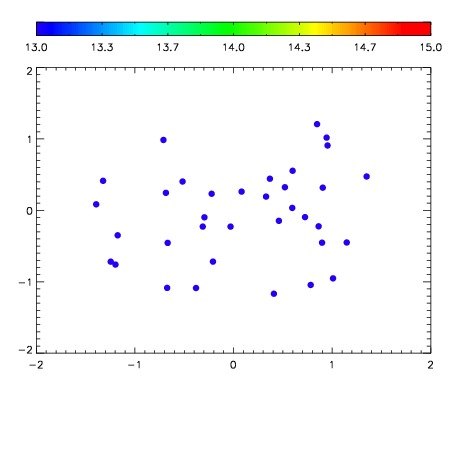

| Frame | Nreads | Zeropoints | Mag plots | Spatial mag deviation | Spatial sky 16325A emission deviations (filled: sky, open: star) | Spatial sky continuum emission | Spatial sky telluric CO2 absorption deviations (filled: H < 10) | |||||||||||||||||||||||
| 0 | 0 |
|
|
|
|
|
|
| IPAIR | NAME | SHIFT | NEWSHIFT | S/N | NAME | SHIFT | NEWSHIFT | S/N |
| 0 | 11710072 | 0.485874 | 0.00000 | 220.679 | 11710074 | -0.00343741 | 0.489311 | 224.622 |
| 1 | 11710071 | 0.485546 | 0.000328004 | 223.079 | 11710073 | -0.00278890 | 0.488663 | 227.063 |
| 2 | 11710075 | 0.484293 | 0.00158098 | 218.712 | 11710077 | -0.00373343 | 0.489607 | 223.189 |
| 3 | 11710076 | 0.485359 | 0.000514984 | 215.180 | 11710070 | 0.00000 | 0.485874 | 214.807 |