| Red | Green | Blue | |
| z | 17.64 | ||
| znorm | Inf | ||
| sky | -Inf | -Inf | -Inf |
| S/N | 24.4 | 43.9 | 49.0 |
| S/N(c) | 0.0 | 0.0 | 0.0 |
| SN(E/C) |
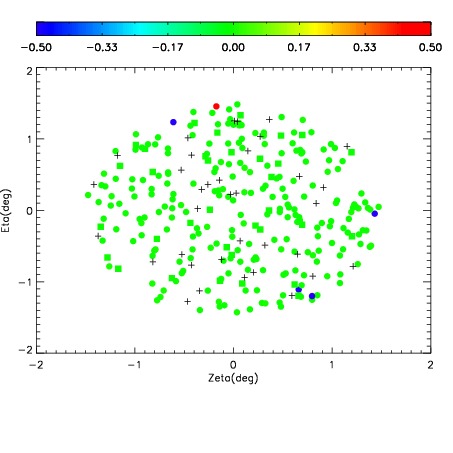
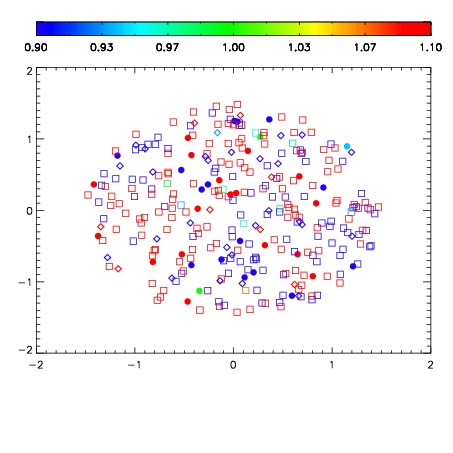
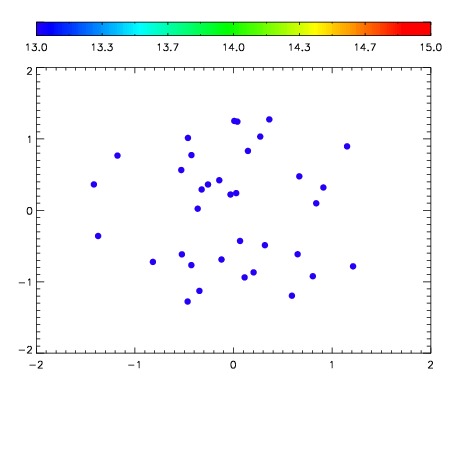

| Frame | Nreads | Zeropoints | Mag plots | Spatial mag deviation | Spatial sky 16325A emission deviations (filled: sky, open: star) | Spatial sky continuum emission | Spatial sky telluric CO2 absorption deviations (filled: H < 10) | |||||||||||||||||||||||
| 0 | 0 |
|
|
|
|
|
|
| IPAIR | NAME | SHIFT | NEWSHIFT | S/N | NAME | SHIFT | NEWSHIFT | S/N |
| 0 | 11360098 | 0.482402 | 0.00000 | 144.361 | 11360100 | 0.00131005 | 0.481092 | 141.302 |
| 1 | 11360097 | 0.480881 | 0.00152099 | 148.637 | 11360103 | 0.000684294 | 0.481718 | 152.326 |
| 2 | 11360102 | 0.482356 | 4.59850e-05 | 147.172 | 11360096 | 0.00000 | 0.482402 | 149.143 |
| 3 | 11360101 | 0.481876 | 0.000526011 | 143.116 | 11360099 | 0.00125792 | 0.481144 | 141.129 |