| Red | Green | Blue | |
| z | 17.64 | ||
| znorm | Inf | ||
| sky | -Inf | -Inf | -Inf |
| S/N | 25.6 | 45.4 | 49.9 |
| S/N(c) | 0.0 | 0.0 | 0.0 |
| SN(E/C) |

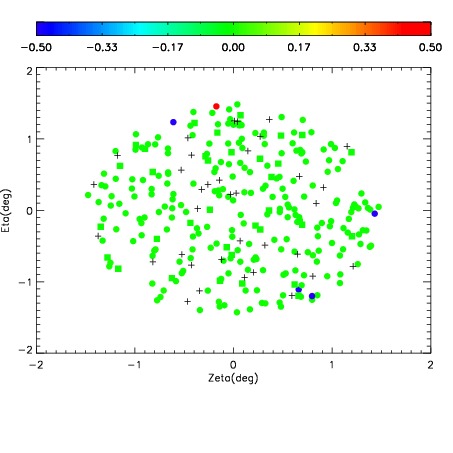
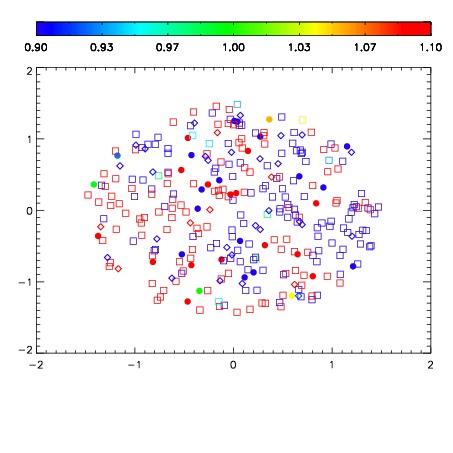
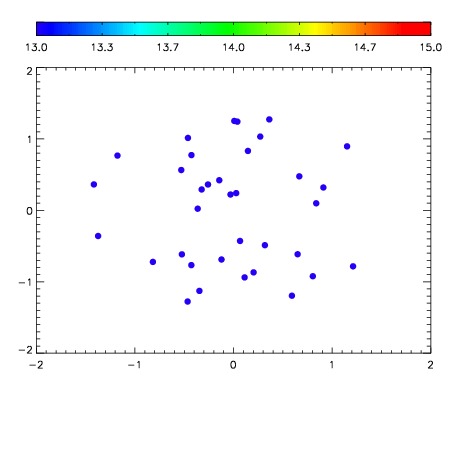

| Frame | Nreads | Zeropoints | Mag plots | Spatial mag deviation | Spatial sky 16325A emission deviations (filled: sky, open: star) | Spatial sky continuum emission | Spatial sky telluric CO2 absorption deviations (filled: H < 10) | |||||||||||||||||||||||
| 0 | 0 |
|
|
|
|
|
|
| IPAIR | NAME | SHIFT | NEWSHIFT | S/N | NAME | SHIFT | NEWSHIFT | S/N |
| 0 | 11380094 | 0.472890 | 0.00000 | 173.182 | 11380092 | 0.00000 | 0.472890 | 173.868 |
| 1 | 11380097 | 0.472472 | 0.000417978 | 173.003 | 11380095 | 3.16894e-05 | 0.472858 | 173.493 |
| 2 | 11380093 | 0.472875 | 1.49906e-05 | 172.295 | 11380096 | -0.000233894 | 0.473124 | 171.301 |
| 3 | 11380098 | 0.472861 | 2.89977e-05 | 167.682 | 11380099 | -0.000155802 | 0.473046 | 166.139 |