| Red | Green | Blue | |
| z | 17.64 | ||
| znorm | Inf | ||
| sky | -Inf | -Inf | -Inf |
| S/N | 25.1 | 44.9 | 48.2 |
| S/N(c) | 0.0 | 0.0 | 0.0 |
| SN(E/C) |

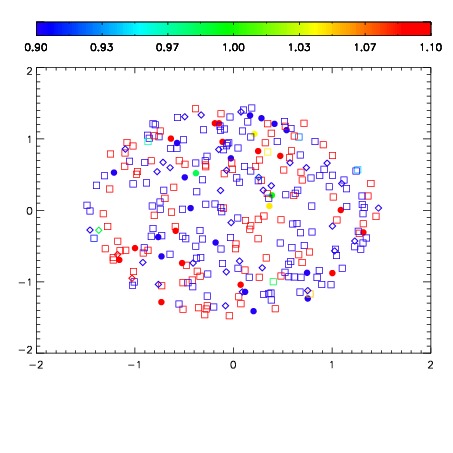
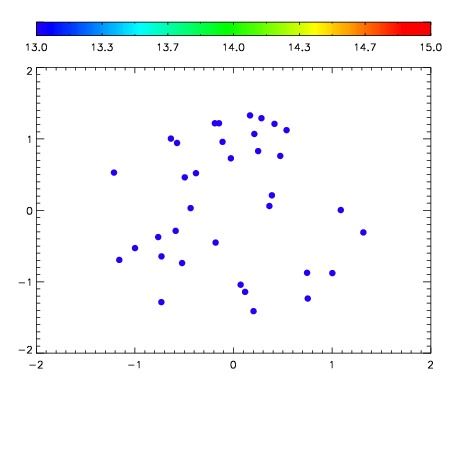

| Frame | Nreads | Zeropoints | Mag plots | Spatial mag deviation | Spatial sky 16325A emission deviations (filled: sky, open: star) | Spatial sky continuum emission | Spatial sky telluric CO2 absorption deviations (filled: H < 10) | |||||||||||||||||||||||
| 0 | 0 |
|
|
|
|
|
|
| IPAIR | NAME | SHIFT | NEWSHIFT | S/N | NAME | SHIFT | NEWSHIFT | S/N |
| 0 | 08760013 | 0.481773 | 0.00000 | 186.379 | 08760014 | -0.000696250 | 0.482469 | 186.801 |
| 1 | 08760017 | 0.480842 | 0.000930995 | 197.474 | 08760018 | -0.000421920 | 0.482195 | 194.097 |
| 2 | 08760016 | 0.480034 | 0.00173900 | 196.029 | 08760015 | -0.000851717 | 0.482625 | 188.288 |
| 3 | 08760012 | 0.480883 | 0.000889987 | 185.332 | 08760011 | 0.00000 | 0.481773 | 180.314 |