| Red | Green | Blue | |
| z | 17.64 | ||
| znorm | Inf | ||
| sky | -Inf | -Inf | -Inf |
| S/N | 34.9 | 62.8 | 66.8 |
| S/N(c) | 0.0 | 0.0 | 0.0 |
| SN(E/C) |
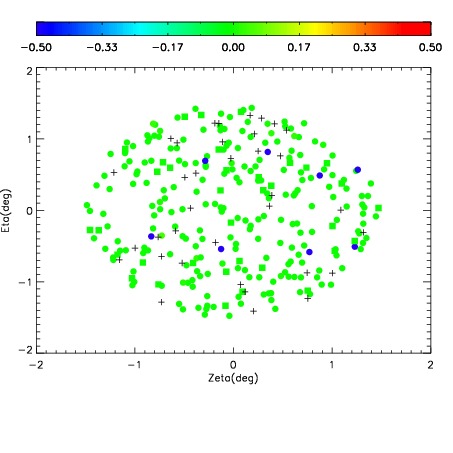
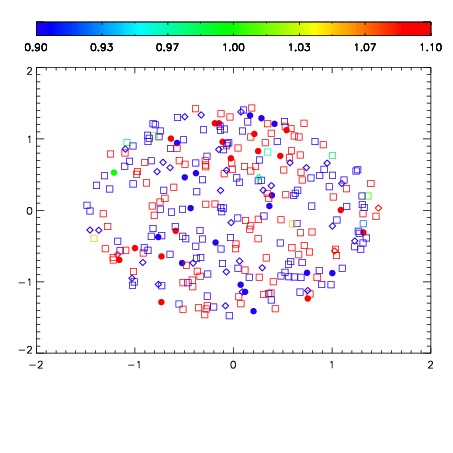
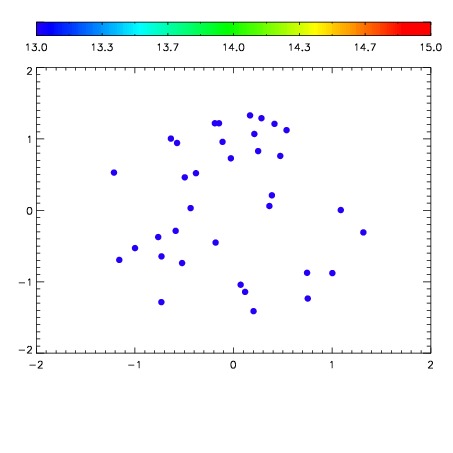

| Frame | Nreads | Zeropoints | Mag plots | Spatial mag deviation | Spatial sky 16325A emission deviations (filled: sky, open: star) | Spatial sky continuum emission | Spatial sky telluric CO2 absorption deviations (filled: H < 10) | |||||||||||||||||||||||
| 0 | 0 |
|
|
|
|
|
|
| IPAIR | NAME | SHIFT | NEWSHIFT | S/N | NAME | SHIFT | NEWSHIFT | S/N |
| 0 | 11120110 | 0.481399 | 0.00000 | 207.735 | 11120111 | 0.00146663 | 0.479932 | 211.031 |
| 1 | 11120098 | 0.479424 | 0.00197500 | 212.246 | 11120100 | -0.00134258 | 0.482742 | 214.208 |
| 2 | 11120101 | 0.478575 | 0.00282401 | 212.100 | 11120099 | -0.00153380 | 0.482933 | 213.345 |
| 3 | 11120109 | 0.480389 | 0.00101000 | 209.223 | 11120096 | 0.00000 | 0.481399 | 212.811 |
| 4 | 11120102 | 0.479087 | 0.00231200 | 207.366 | 11120103 | 2.35932e-05 | 0.481375 | 206.746 |
| 5 | 11120105 | 0.478415 | 0.00298399 | 205.075 | 11120104 | -0.000212525 | 0.481612 | 203.586 |
| 6 | 11120106 | 0.478549 | 0.00285000 | 204.821 | 11120107 | -0.000966348 | 0.482365 | 201.717 |
| 7 | 11120097 | 0.478547 | 0.00285199 | 198.892 | 11120108 | -0.000919112 | 0.482318 | 199.332 |