| Red | Green | Blue | |
| z | 17.64 | ||
| znorm | Inf | ||
| sky | -NaN | -Inf | -Inf |
| S/N | 21.3 | 38.9 | 43.1 |
| S/N(c) | 0.0 | 0.0 | 0.0 |
| SN(E/C) |
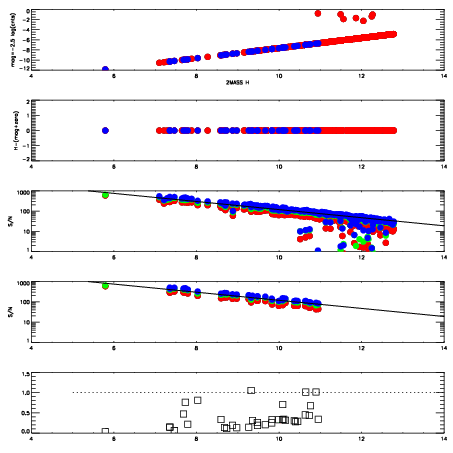

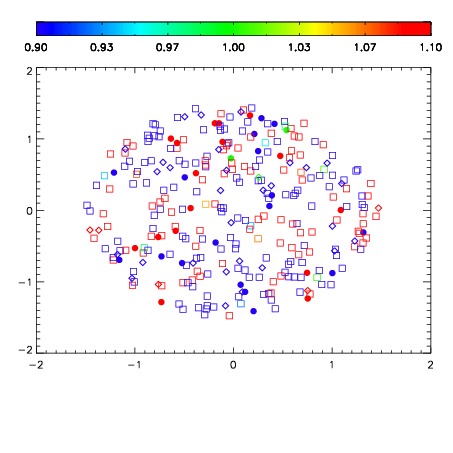
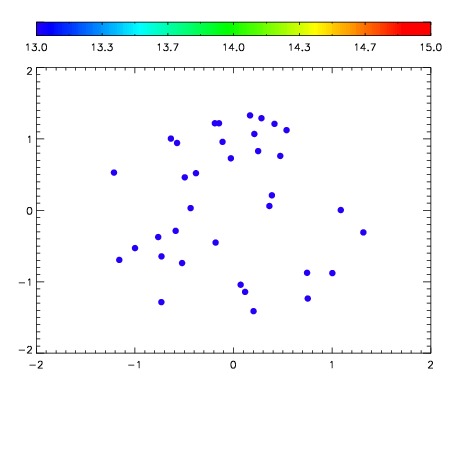

| Frame | Nreads | Zeropoints | Mag plots | Spatial mag deviation | Spatial sky 16325A emission deviations (filled: sky, open: star) | Spatial sky continuum emission | Spatial sky telluric CO2 absorption deviations (filled: H < 10) | |||||||||||||||||||||||
| 0 | 0 |
|
|
|
|
|
|
| IPAIR | NAME | SHIFT | NEWSHIFT | S/N | NAME | SHIFT | NEWSHIFT | S/N |
| 0 | 11160067 | 0.482791 | 0.00000 | 178.002 | 11160065 | -0.00331567 | 0.486107 | 180.843 |
| 1 | 11160062 | 0.478585 | 0.00420600 | 188.151 | 11160068 | -0.00225337 | 0.485044 | 189.356 |
| 2 | 11160063 | 0.479829 | 0.00296199 | 180.927 | 11160064 | -0.00383076 | 0.486622 | 188.311 |
| 3 | 11160066 | 0.481660 | 0.00113100 | 172.116 | 11160061 | 0.00000 | 0.482791 | 170.235 |